
Figure 9.
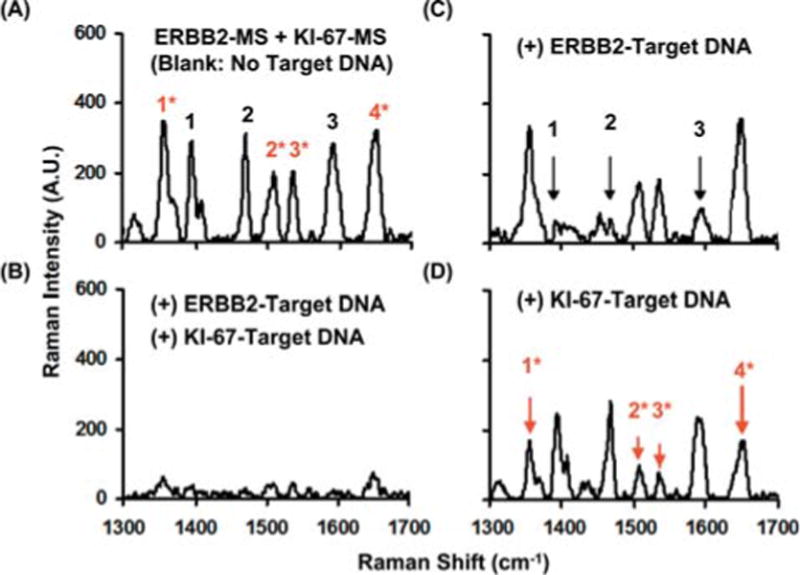
(online color at: www.biophotonics-journal.org) SERS spectra of the MS nanoprobe mixture (ERBB2-MS + KI-67-MS) in the presence or absence of target DNA. The major Raman bands from ERBB2-MS are marked with black numbers, and the major Raman bands from KI-67-MS are marked with red numbers and an asterisk. (A) blank (in the absence of any target DNA). (B) in the presence of two target DNA complementary to both MS nanoprobes. (C) in the presence of target DNA complementary to the ERBB2-MS nanoprobes. (D) in the presence of target DNA complementary to the KI-67-MS nanoprobes. The arrows illustrate the decreased SERS intensity of the major Raman bands in the presence of corresponding target DNA (adapted from Ref. [44]).