
Figure 1.
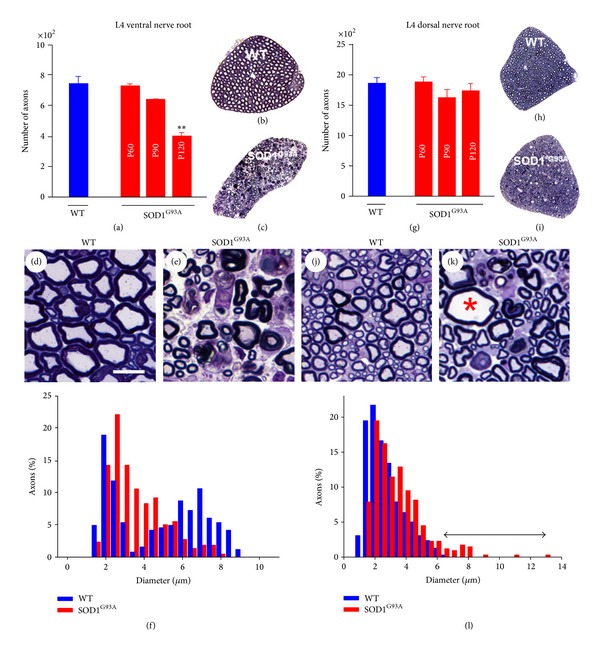
Morphometric analysis of motor (L4 VRs, (a)–(f)) and sensory (L4 DRs, (g)–(l)) axons from WT and SOD1G93A mice. An analysis was performed on 1 μm semithin plastic transversal sections ((b), (c), (h), and (i)). ((a)–(c) and (g)–(i)) Counts showed a significant loss of the total number of motor, but not sensory, axons in the end-stage (P120) SOD1G93A mice ((a) and (g)). ((d)–(f) and (j)–(l)) A frequency distribution analysis of myelinated axon size in WT VRs showed a clear bimodal profile (f) indicative of axons coming from α-MNs (large) and γ-MNs (small); note the selective loss of large axons in SOD1G93A mice. Representative images of WT and SOD1G93A ventral nerve are shown in (d) and (e); note the presence of abundant degenerating axons in SOD1G93A animals. Although there was no evidence of the loss of sensory axons in dorsal nerve roots in SOD1G93A mice, a more detailed examination of nerve profile morphology ((j) and (k)) revealed the presence of moderate numbers of axons exhibiting significant degrees of swelling (∗) and other degenerating features. A frequency distribution analysis of myelinated axon size in dorsal nerve roots (l) reflected the appearance of a new population of large diameter (degenerating) sensory axons in SOD1G93A samples (indicated by a double arrowed line). The bars in the graphs represent the mean ± SEM values of counts performed in 2–11 animals per age and experimental condition; **P < 0.01 versus WT, one-way ANOVA, Bonferroni's post hoc test). Scale bar in D = 10 μm (valid for (e), (j), and (k)).