
Figure 4.
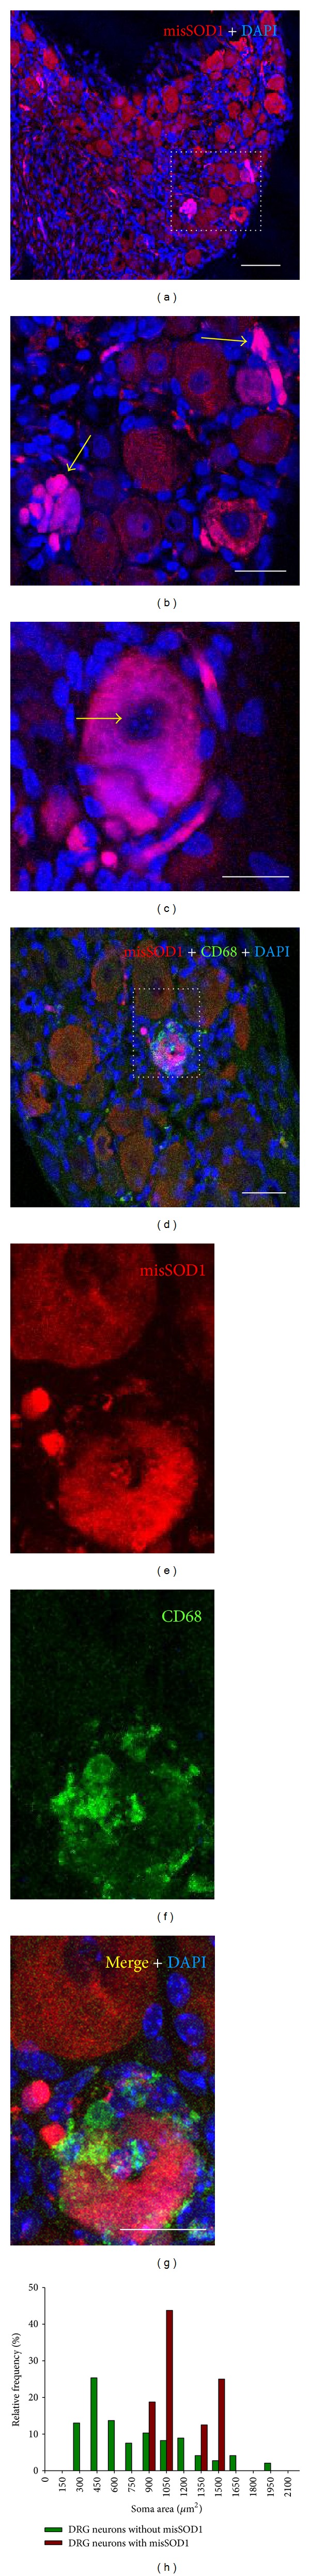
((a)–(c)) Misfolded SOD1 (misSOD1) immunolabeling using AJ10 antibody (red) reveals highly immunoreactive neuronal somata within the DRG (delimited in (a)) of end-stage (P120) SOD1G93A mice. Some neuronal somata display cytoplasmic fragmentation indicative of degenerative changes (arrows in (b)); nuclei, counterstained with DAPI (blue), do not show apoptotic morphology (arrows in (c)). ((d)–(g)) Misfolded SOD1 immunolabeling (red) was combined with an anti-CD68 antibody (green) to reveal activated macrophagic cells; DAPI (blue) was used for nuclear staining. A degenerating neuron expressing misfolded SOD1 (delimited in (d)) and displaying clustered profiles of CD68 positive phagocytic cells is shown in high magnification in (e)–(g). (h) A frequency distribution profile of the size of the DRG neuron somata containing misfolded SOD1 with respect to that of the whole neuronal population; note that misfolded SOD1 positive neurons belong to the large-sized (presumably proprioceptive) population. Scale bars: 80 μm in (a), 40 μm in (b), (c), (d), and (g) (also valid for (e) and (f)).