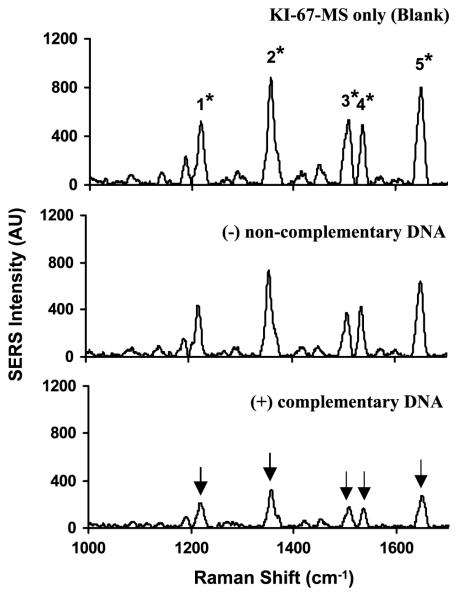
Figure 5.
SERS spectra of the KI-67-MS nanoprobes in the presence or absence of complementary DNA targets. Upper spectrum: blank (no target DNA present). Middle spectrum: in the presence of 0.5 μM non-complementary DNA (negative control). Lower spectrum: in the presence of 0.5 μM complementary target DNA (positive diagnostic).

