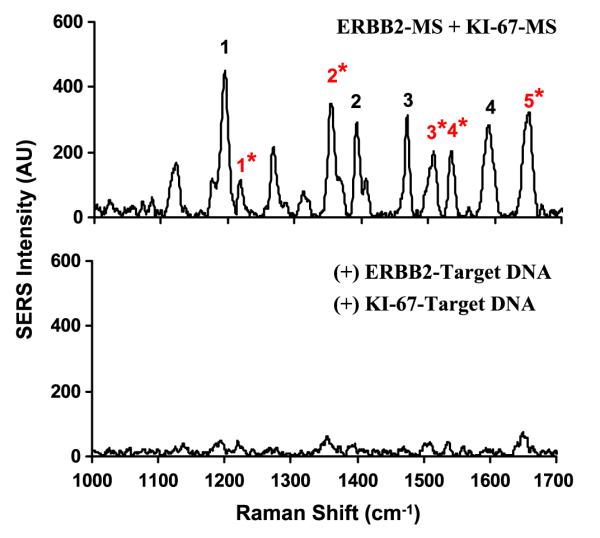
Figure 6.

SERS spectra of the composite MS nanoprobes (ERBB2-MS + KI-67-MS) in the presence or absence of target DNA. The major Raman bands from ERBB2-MS are marked with black number, and the major Raman bands from KI-67-MS are marked with red number with (*) sign. Upper spectrum: blank (in the absence of any target DNA). Lower spectrum: in the presence of two target DNA complementary to both MS nanoprobes.
