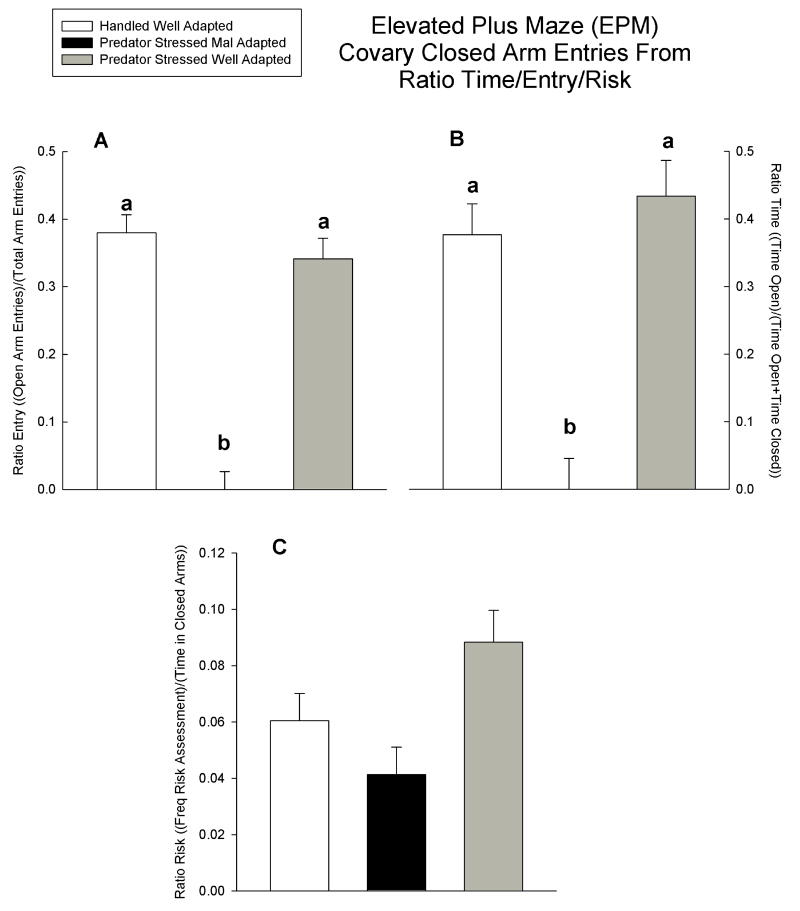
Figure 2.
Plotted across handled, and stressed mal- and well-adapted groups in Figures A - C are mean + SEM of measures of open arm exploration (ratio time/entry) and risk in the EPM after covarying closed arm entries from them. Within a given behavioral plot, means marked with the same letter do not differ, means marked differently differ. Unmarked means in C do not differ.

