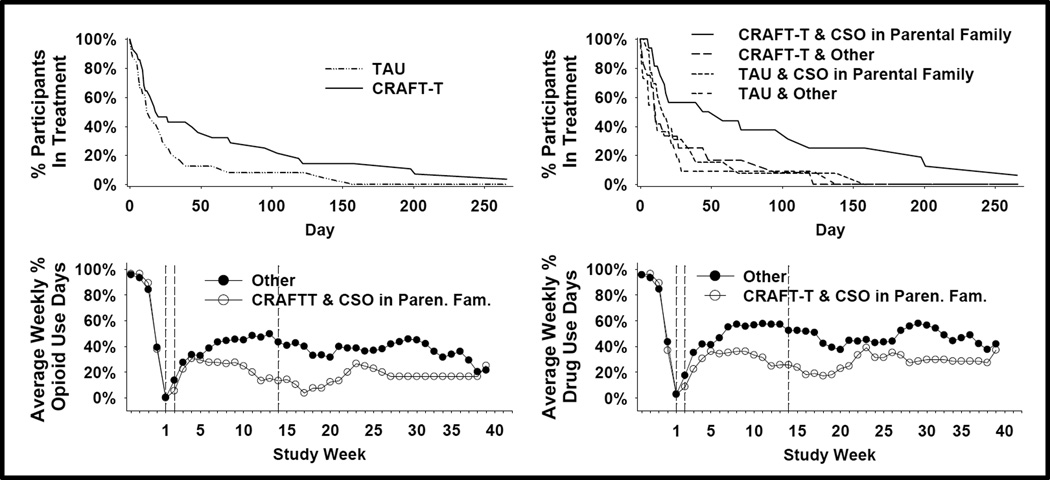
Figure 1.
(a,b) Survival curves for IP retention in drug abuse treatment are shown. Time point 0 is baseline and 1 – 250 are days in drug abuse treatment following randomization. (c,d) Comparison of treatments on TLFB reports of weekly percentage of opioid use and any drug use days are shown. Weeks 1 – 2 are treatment weeks in which both the CSO and IP attend CRAFTT sessions, 3 –14 are the weeks in which only the CSO attends CRAFT-T sessions, and weeks 15–40 are follow-up.

