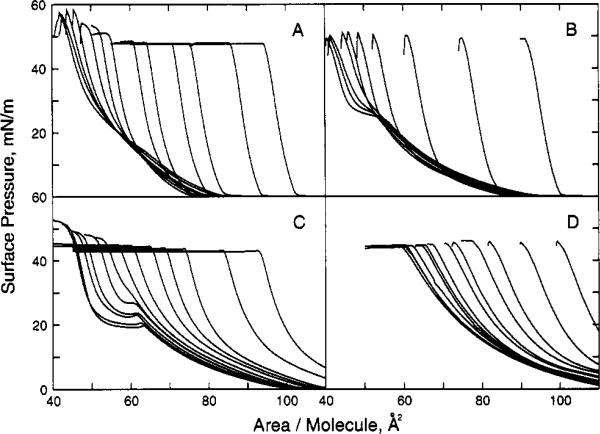
Figure 2.
Surface pressure vs apparent molecular area of sphingolipid/phospholipid. Experimental conditions same as in Figure 1. Panel A shows bovine brain SM with increasing mole fractions of cholesterol (same Xchol as Figure 1A). Panel B shows 1-myristoyl-2-palmitoyl-PC with increasing mole fractions of cholesterol (from left to right at π = 30 mN/m; Xchol = 0, 0.05, 0.1, 0.15, 0.2, 0.25, 0.3, 0.4, 0.5, 0.6). Panel C shows dinervonoyl (24:1Δ15)-PC with increasing mole fractions of cholesterol (same Xchol as Figure 1A). Panel D shows 1-palmitoyl-2-arachidonoyl-PC with increasing mole fractions of cholesterol (same Xchol as Figure 1A).

