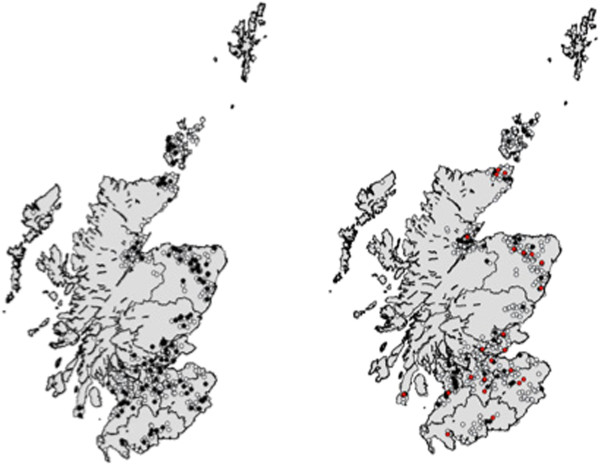
Figure 1.
The geographical distribution of Scottish farms from both Survey 1 (SEERAD, left) and Survey 2 (IPRAVE, right) surveys (n = 447). Left: Survey 1 (SEERAD, 1998-2000). White circles represent E. coli O157 negative farms, black circles represent E. coli O157 positive farms. Right: Survey 2 (IPRAVE, 2002-2004). White circles represent O157 negative farms, black circles represent E. coli O157 positive farms and red circles represent the 27 farms that were E. coli O157 positive in both surveys.

