Figure 4.
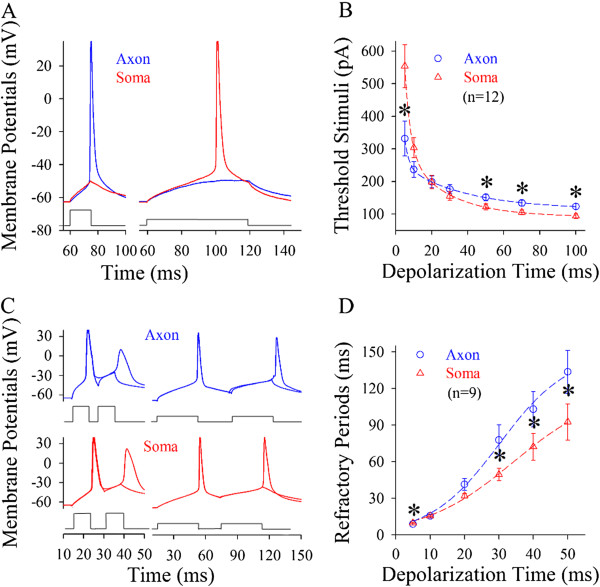
Spike thresholds and refractory periods are changed dynamically by the patterns of input signals at the soma vs. axon. A) Axonal spike thresholds appear low by short-time pulses (blue trace) and somatic ones are lower by long-time pulses (red). B) shows threshold stimuli vs. depolarization time at the soma (triangle symbols) and the axon (circles, n = 12). C) Left panels show that spike refractory periods appear short at the axon (blue traces at top panels) by short-time pulses. Right panels show that refractory periods are short at the soma (red lines at bottom panels) by long pulses. D) shows refractory periods vs. depolarization time at the soma (triangle symbols) and axon (circles, n = 9). Asterisks present p < 0.05.

