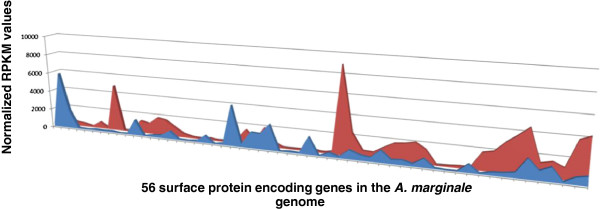
Figure 1.

Whole genome comparison ofA. marginaletranscriptional activity in ISE6 cells v. blood. The normalized RPKM values for 56 surface protein encoding genes are shown on the y axis. Features are arranged from left to right as they appear on the A. marginale chromosome on the x axis. RPKM values for A. marginale transcription in ISE6 cells are shown in blue; values for transcripts in blood are shown in red.
