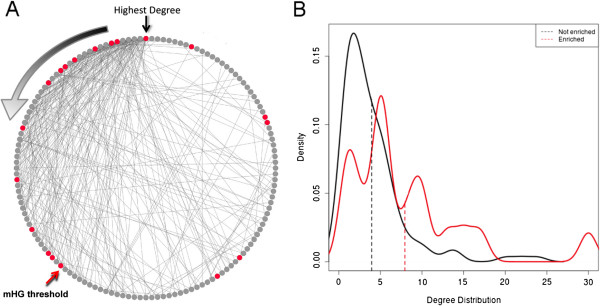
Figure 3.

VirMic enriched pathways show higher association with other metabolic pathways. (A) A circle display of the pathways in the global metabolism network sorted according to network degree. Red nodes represent pathways enriched in VirMic. Black arrow indicates the pathway with the highest degree. Degree decreases in a counter-clockwise manner (gradient arrow). Red arrow represents the highest ranked pathways in which enrichment of viral pathways was detected. (B) Degree distribution of pathways enriched in viral reads (red) and pathways not enriched in viral reads (black). Dashed lines mark the means of the two distributions.
