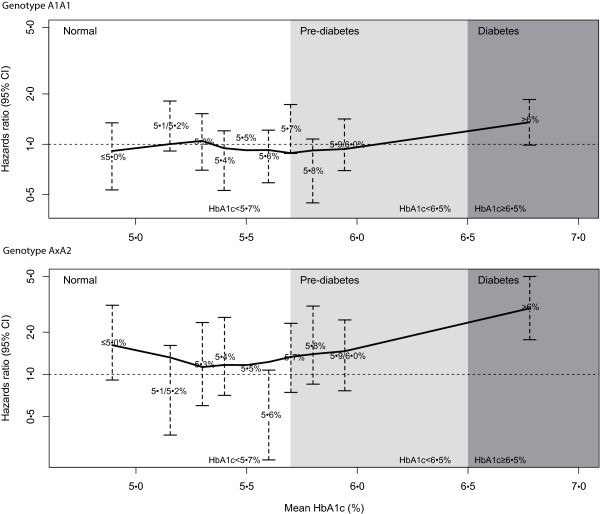
Figure 1.
Multivariate adjusted hazards ratio of mortality by category of HbA1c level in people with different genotypes. Definition of pre-diabetes and diabetes follows definition criteria of the American Diabetes Association (ADA) (20). The hazard ratios and 95% confidence interval are given for each decile of HbA1c level (≤5% (31 mmol/mol), 5.1% (32 mmol/mol)/5.2% (33 mmol/mol), 5.3% (34 mmol/mol), 5.4% (36 mmol/mol), 5.5% (37 mmol/mol), 5.6% (38 mmol/mol), 5.7% (39 mmol/mol), 5.8% (40 mmol/mol), 5.9% (41 mmol/mol)/6.0% (42 mmol/mol), >6.5% (48 mmol/mol)), taking HbA1c = 5.5% (37 mmol/mol) as the reference. The position of the points on the x-axis represents the median value of baseline HbA1c in the decile. The model was adjusted for age, sex, waist-hip ratio, RR diastolic, RR systolic, total cholesterol, HDL cholesterol, LDL cholesterol, smoking status (categorized: non-smoker, former smoker, current smoker), alcohol intake (categorized: ≥20 g/day for women; ≥40 g/day for men), physical activity (categorized: >1 h per week), platelet mass, mean plate volume and platelet count.

