Figure 5.

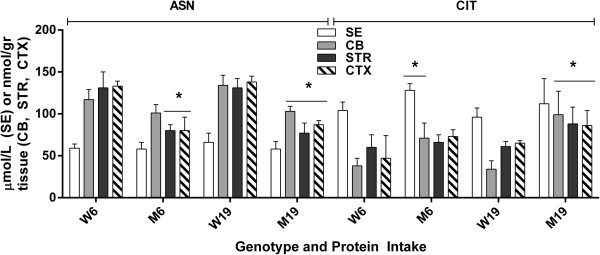
Asparagine and citrulline level as a function of protein intake and tissue. Two-way ANOVA, p < 0.05 for protein intake and interaction, p = ns for tissue. Two-tailed t-test, *p < 0.05 between genotype with identical protein intake.

Asparagine and citrulline level as a function of protein intake and tissue. Two-way ANOVA, p < 0.05 for protein intake and interaction, p = ns for tissue. Two-tailed t-test, *p < 0.05 between genotype with identical protein intake.