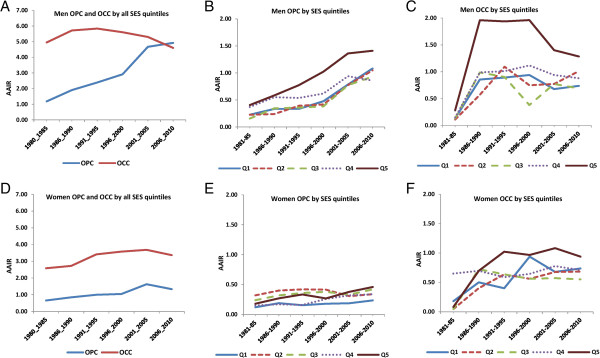
Figure 2.

Temporal trends in AAIR (age-adjusted incidence rates) from 1981-2010 for OPC (oropharyngeal cancers) and OCC (oral cavity cancers) by SES (socioeconomic status) quintiles and sex. Q1 is the least deprived quintile while Q5 is most deprived quintile. (A) OPC and OCC for men, for all quintiles together. (B) OPC in men, by quintile. (C) OCC in men, by quintile. (D) OPC and OCC for women, for all quintiles together. (E) OPC in women, by quintile. (F) OCC by women, by quintile.
