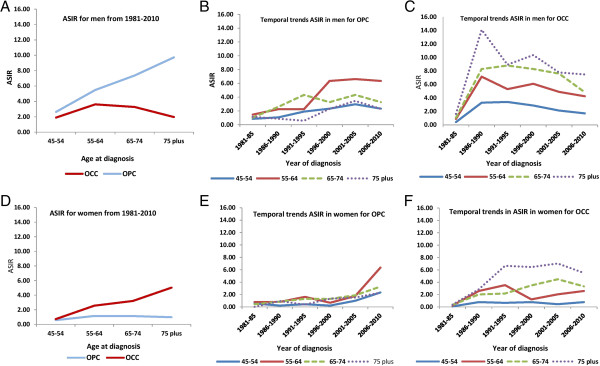
Figure 4.

ASIR (age-standardized incidence rates) for OPC (oropharyngeal cancers) and OCC (oral cavity cancers) in the lowest SES (socioeconomic status) quintile (q5). Comparisons are made by sex. For men: (A) By age, over the total study period, comparing OPC and OCC. (B) Temporal trends by age for OPC. (C) Temporal trends by age for OCC. For women: (D) By age over the total study period. (E) Temporal trends by age for OPC. (F) Temporal trends by age for OCC.
