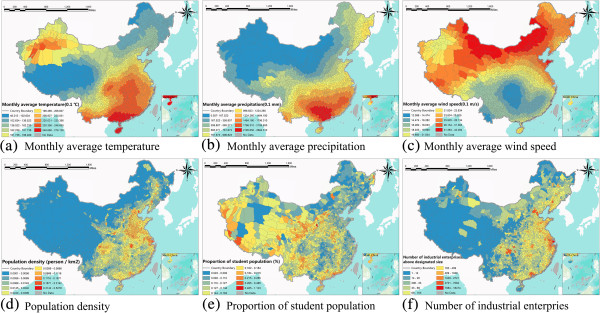
Figure 3.

The spatial distribution of selected exposure factors in the regression model in China in May 2008. (a) Monthly average temperature. (b) Monthly average precipitation. (c) Monthly average wind speed. (d) Population density. (e) Proportion of student population. (f) Number of industrial enterprises above designated size.
