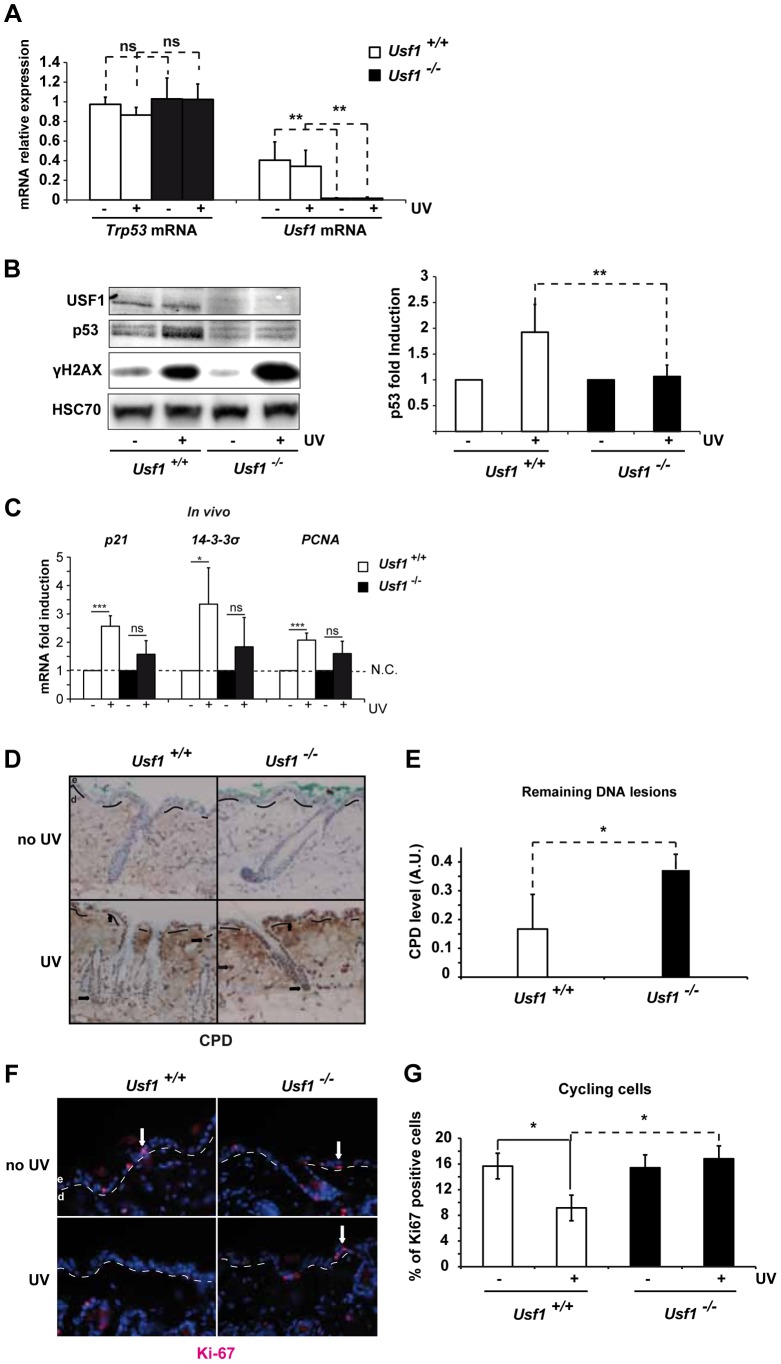
Figure 1. Usf1 KO mice present defective induction of p53 protein.
The back of Usf1 KO mice (Usf1-/-) and WT mice (Usf1+/+) were irradiated or not irradiated with an UVB dose corresponding to the mice MED (5 kJ/m2) and the skin was analyzed 5 h later. (A) RT-qPCR analysis of Trp53 and Usf1 mRNA relative level (expressed as a ratio to the value for the Hprt transcript) in skin extracts from protected (-) and UV-exposed (+) areas. Error bars: SD, n>9. (B) Western blot showing USF1, p53, γH2AX and HSC70 (loading control) immunoreactivity 5 h after skin irradiated or not irradiated with UVB. The graph reports the mean ratio between the p53 signal (normalized to that for HSC70) in skin-exposed areas versus non-irradiated areas (controls). Error bars: SD, n = 8 for each condition. (C) Usf1+/+ (Usf1 WT) and Usf1-/- (Usf1 KO) skins were or were not irradiated with UVB (5 kJ/m2) and analyzed for the induction of transcripts in vivo. RT-qPCR analysis of CDKN1a (p21), SFN (14-3-3σ) and PCNA transcripts in UVB-irradiated skin and non-exposed controls; values reported were normalized to those for the Hprt transcript. Transcripts were assayed in vivo 5 hours after irradiation. Error bars: SD, n = 4 in vivo (D) Immunohistochemical labeling of cyclobutane pyrimidine dimers (CPD) showing their localization and abundance in skin areas (x100) exposed or not exposed to UVB. Dashed lines indicate the boundary between the dermis (d) and the epidermis (e), and arrows indicate positive nuclei. (E) The level of CPDs in total DNA extracts from skin was quantified by ELISA. The graph shows the mean difference in the CPD absorbance values between for exposed and protected skin areas. Error bars: SD, n = 4. (F) Immunofluorescence staining with the Ki-67 antibody of inter-follicular cycling cells in skin areas (x100) exposed or not exposed to UVB. (G) The graph shows the mean percentage of cycling cells (calculated as Ki-67-positive cells/total Dapi-stained cells) in protected and UV-exposed skin areas. Error bars: SD, n = 3. Student's t test was used to test the significance of differences (*, p <0.05, **, p<0.01, ***, p<0.001).

