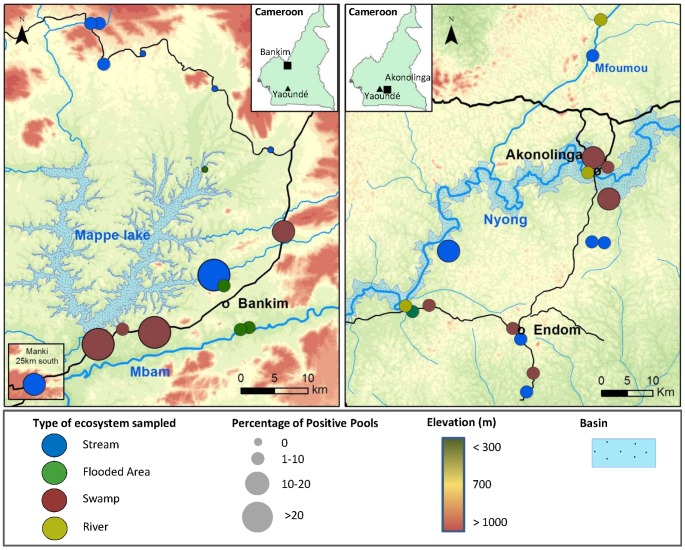
Figure 1. M. ulcerans spatial distribution in water bodies sampled in Cameroon from June 2012 to Mai 2013.
Maps show regional distribution of M. ulcerans in water bodies sampled in Bankim (Left) and Akonolinga (Right). Each circle is a site and colors represent the type of ecosystem sampled. The size of the circles varies according to the percentage of pools that were qPCR positive to both KR and IS2404. Inlet figures illustrate a map of Cameroon with the location of Yaoundé, the capital city (dark triangle) and locations of Bankim and Akonolinga (dark squares).

