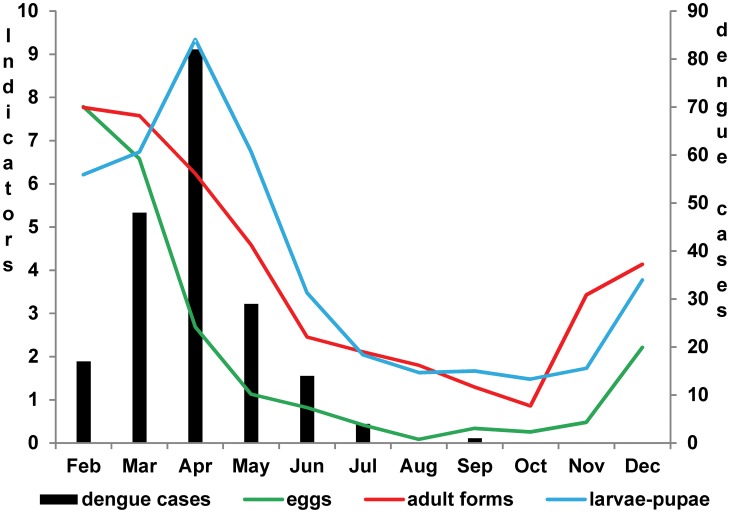
Figure 2. Dengue cases and entomological indicators in stages: egg, larvae-pupae and adult forms.
Legend of Figure 2: The bar chart shows the number of dengue cases in the study area and the lines show the entomological indicators measured from February to December 2011. In order to compare the indicators seasonality in the same scale, the numbers of eggs were divided by 500 and the indicator of adult forms was divided by 5.

