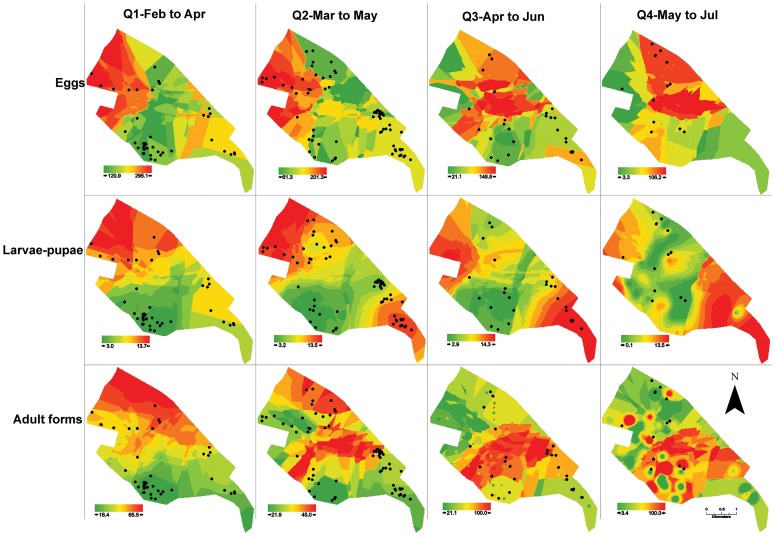
Figure 3. Ordinary Kriging maps of entomological indicators of Aedes aegypti and dengue cases.
Legend of Figure 3: The figure shows the estimated ordinary kriging of entomological indicators from February to July 2011 divided in four groups quarterly. The cases that occurred in the month corresponding to the middle of the period by each cluster are also plotted as black dots in the maps. The color gradient, corresponding to the variation range of the estimated entomological indicators, is shown for each map. For eggs indicator the values represent to the number of eggs. For indicators of larvae-pupae and adult mosquitoes, the values match to the percentage of positivity of blocks.

