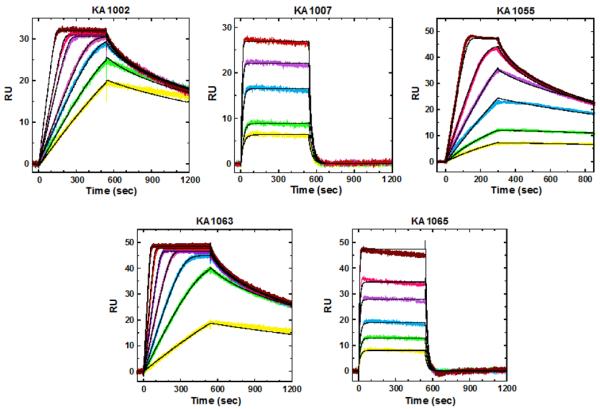
Figure 4.

SPR sensorgrams (color) and the global kinetics fits (black overlays) for the interaction of PAs (Figure 3) with the 5'-biotin labeled hairpin DNA sequence, 5'-biotin-CCTTGGCTTCTTTTGAAGCCAAGG-3' [37, 39]. The concentrations from bottom to top are: 1.5, 2, 2.5, 3, 5, 6, 9 nM for KA1002; 5, 10, 20, 40, 60 nM for KA1007; 2, 3, 4, 6, 8, 15 nM for KA1055; 1, 2, 4, 6, 10, 15, 25 and 10, 20, 40, 100, 200, 400 nM for KA1063 and KA1065, respectively.
