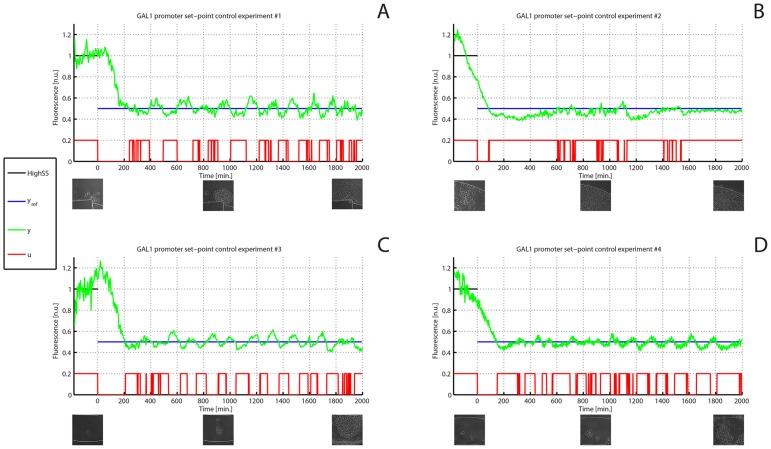
Figure 5. In-vivo set point control experiments on the GAL1 promoter.
(A–D) Four in-vivo set point control experiments were performed on the GAL1 promoter. The desired ( in blue) and experimentally quantified GFP fluorescence (
 in green) in the cell population are shown for the whole duration of the experiments; the control action starts at time
  and lasts for
  . The fluctuations in fluorescence during the
  calibration phase are due to stress response after loading cells in the microfludics device. The input signal
  , computed in real-time by the control algorithm, is shown in red: a high signal corresponds to galactose-rich growth medium, a low signal to glucose growth medium. (Insets) Images taken during the experiments show the growing yeast populations at the beginning, at the half and at the end of each experiment.

