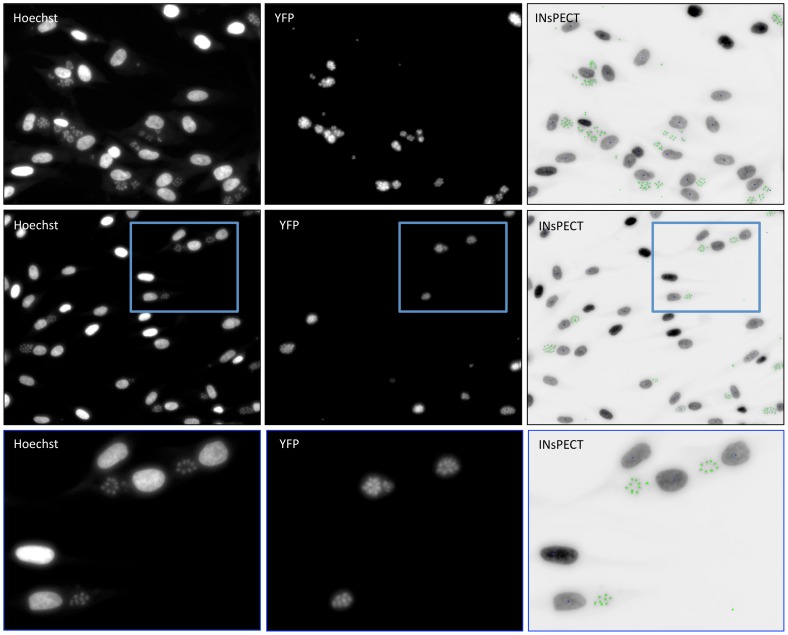
Figure 4. INsPECT output image analysis of T. gondii infected HFF cells.
Representative images of T. gondii infected cells with Hoechst stain (left) and filter for YFP-expressing parasites detection (center). Analyze of the corresponding Hoechst images with INsPECT software (right), showing annotated parasites and cells as green and blue dots respectively. A close-up of a selected area (blue square) is shown in the lowest panel.

