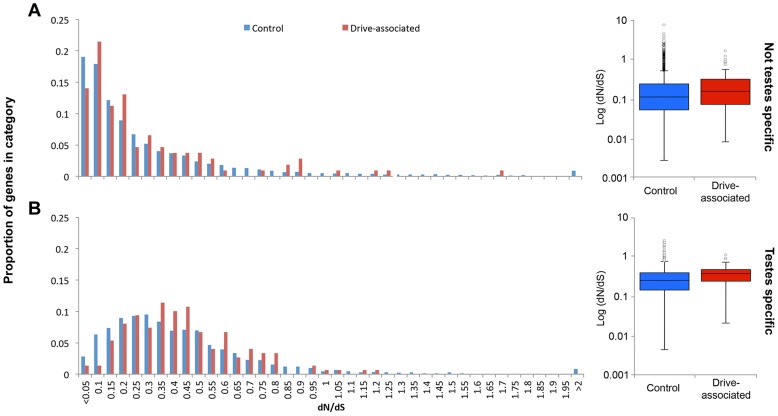
Figure 3. Drive-associated transcripts show elevated rates of protein evolution.
(A) Drive-associated transcripts (red) show higher dN/dS, calculated for all transcripts with orthologs in the T. whitei testes transcriptome, than controls (blue) and this holds true when (B) only testes-specific genes are compared. Across all genes, testes-specific genes have elevated median dN/dS compared to genes with expression in other tissues (compare A to B).

