
Figure 1. Phase resetting curve measurement and interval mapping.
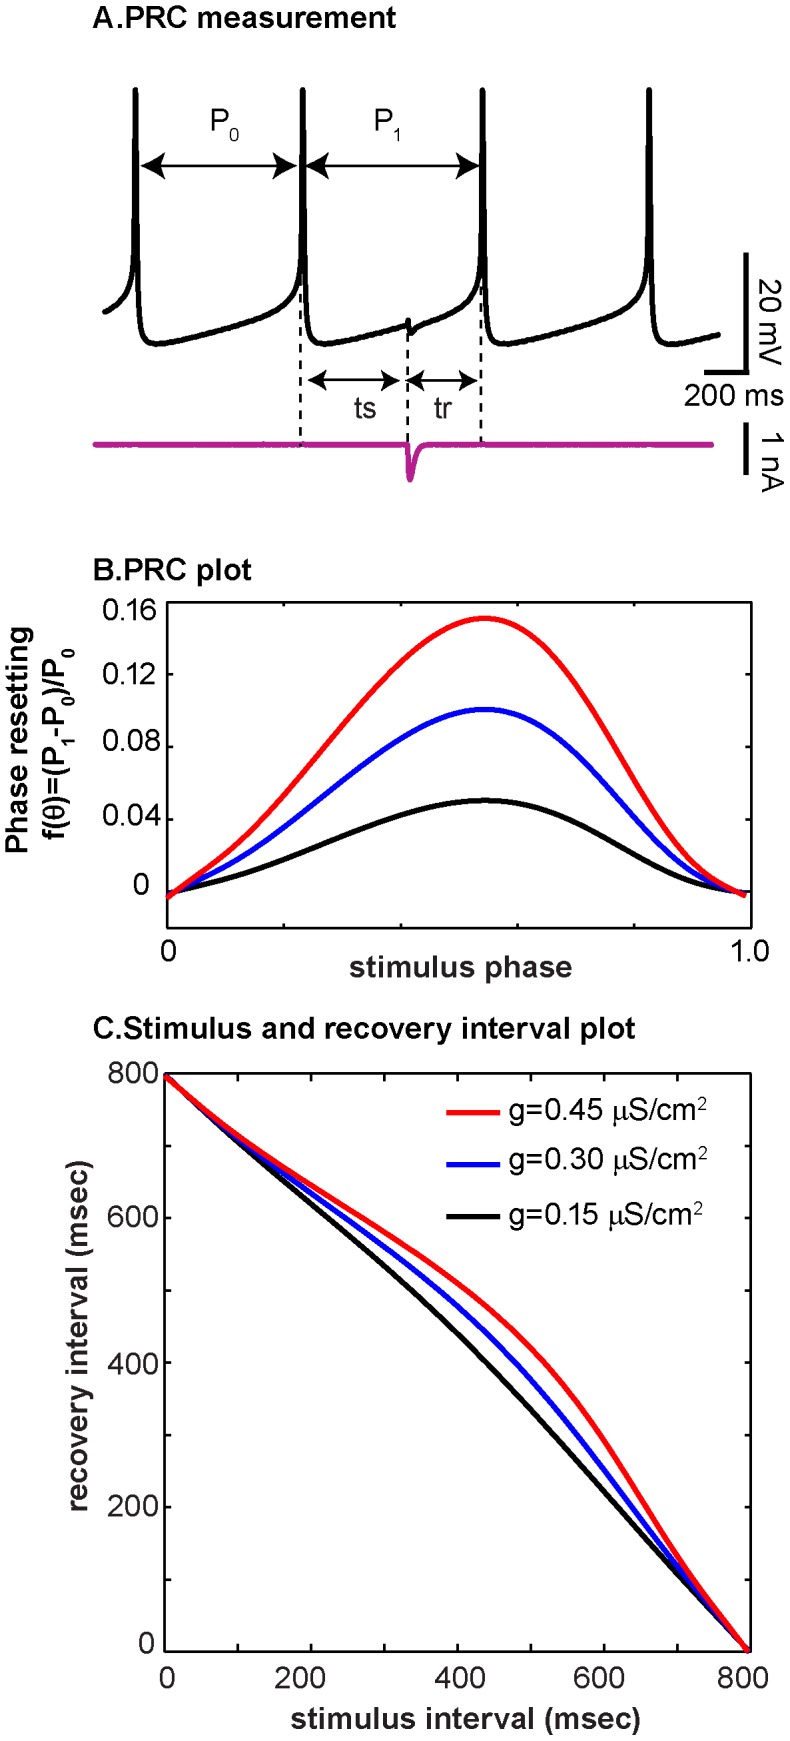
(A) Illustration of how inhibitory perturbations are applied at various intervals after the reference spike, using a trace from the biological neuron as measured in experiment 19. (B) Phase resetting curves are plotted as stimulus phase ts/P0 vs phase reset (P1-P0)/P0 for different inhibitory synaptic conductance strengths (µS/cm2) given in the inset to panel C. The blue trace is a PRC measured in the model neuron from experiment 19, using the dynamic clamp operating at 10 kHz with gsyn = 0.3 µS/cm2. The estimated PRCs for gsyn = 0.15 and 0.45 µS/cm2 were approximated by scaling the measured PRC. (C) Information from the PRC can be plotted instead as recovery interval (tr) vs. stimulus interval (ts). Notice that PRCs with substantial curvature can appear relatively flat in the ts-tr plane.