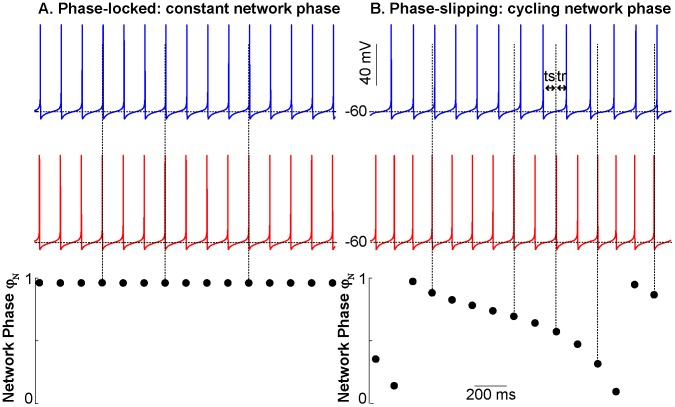
Figure 2. Schematic illustration of phase-locking and slipping motifs in two-neuron networks.
The top traces show the membrane potential traces of two coupled model neurons, whereas the bottom trace shows the network phase for every spike in the red neuron relative to the spikes in the blue neuron that bracket it. Vertical dashed lines show the point within the cycle of the blue neuron at which a spike in the red neuron occurs. (A) One neuron spikes consistently at the same point within the interspike interval of the other neuron. Phase-locking occurs and coupled neurons have a consistent, stable phase relationship. (B) One neuron spikes faster than the other neuron and in this case, phase slipping occurs. The spike in the red trace occurs at progressively earlier points during the interspike interval between the blue spikes until a blue interspike interval actually contains two red spikes.

