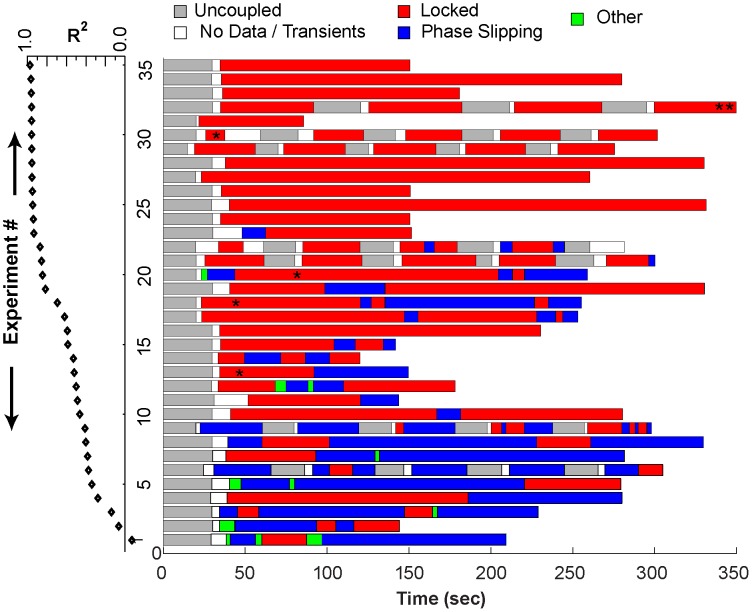
Figure 3. Schematic representation of network activity observed for 35 different hybrid circuits.
Each experiment is represented by a color-coded band, indicating episodes of phase-locking (red), phase slipping (blue), no coupling (gray), initial transients or missing data (white) or unclassified (green). Red segments containing an asterisk were phase-locked with zero phase difference. Experiments were ordered with the lowest R2 statistic (black diamonds) during coupled episodes at the bottom. Data from experiment 32 (double asterisk) indicates that only the first 350 seconds of the record were shown, but the phase-locked pattern continued. The single asterisk within red segments corresponding to experiments 13, 18, 20 and 30 are episodes of near synchrony.

