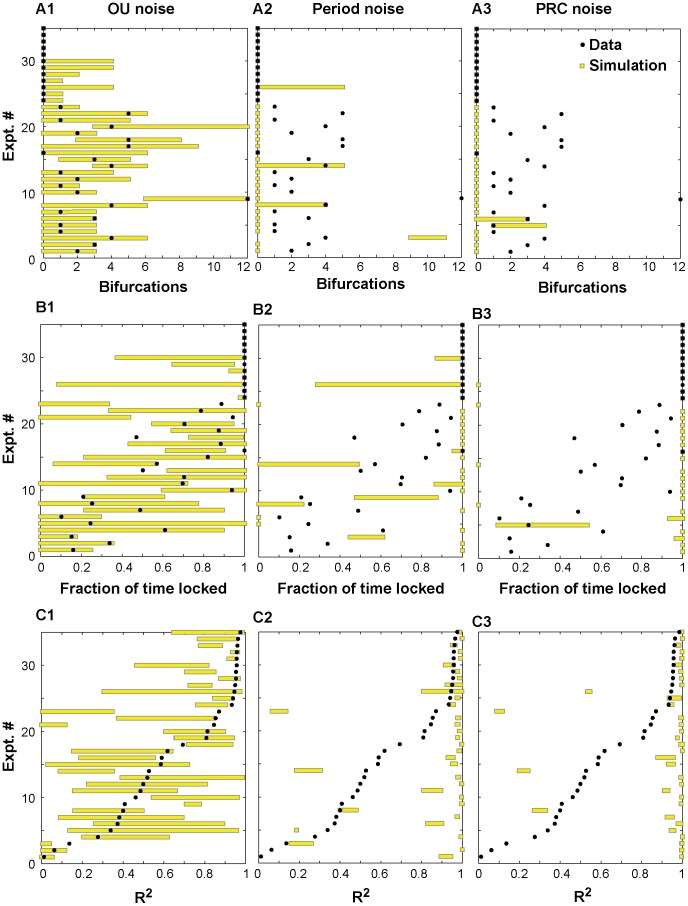
Figure 10. Performance metrics for noise models.
The metrics are (A) Bifurcation, or the number of transitions between phase-locked and phase-slipping states, observed in each hybrid experiment; (B) Fraction of time in each experiment spent in a phase-locked state; and (C) the R2 metric for each experiment. In each panel, the y axis indicates an experiment number. For each experiment, the black dot represents the metric for that experiment, and the yellow bar represents the range of results for 10 simulations of each of the three noise models using 10 random seeds. Ideally, the bar (range of simulation results) should enclose the dot. The Ornstein-Uhlenbeck noise model in A1 brackets the experimental data in all cases, whereas Gaussian noise added to the period in A2 and PRC in A3 fail to bracket the observed bifurcation in most cases. (B) The Gaussian noise models in B2 and B3 had less effective variability than the OU model in B1, so the OU model was better able to capture fraction of time spent phase-locked. In contrast, the Gaussian noise models had a tendency to produce simulations that were always phase-locked, or to a lesser degree that were always slipping. (C) The OU model in C1 usually bracketed the data points for the R2 metric, but the other models (C2 and C3) in general did not.

