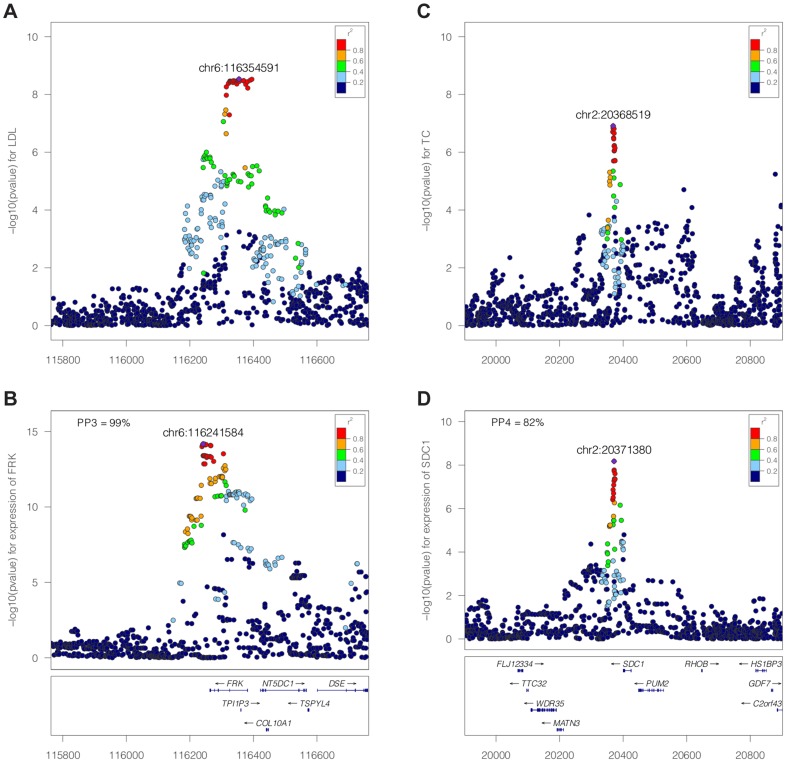
Figure 2. Illustration of the colocalisation results.
Negative [SPACE] (A–B, FRK gene and LDL, PP3 >90%) and positive (C–D, SDC1 gene and total cholesterol, PP4 >80%) colocalisation results. −log10(p) association p-values for biomarker (top, A and C) and −log10(p) association p-values for expression (bottom, B and D) at the FRK (A, B) and SDC1 locus (C, D), 1Mb range.

