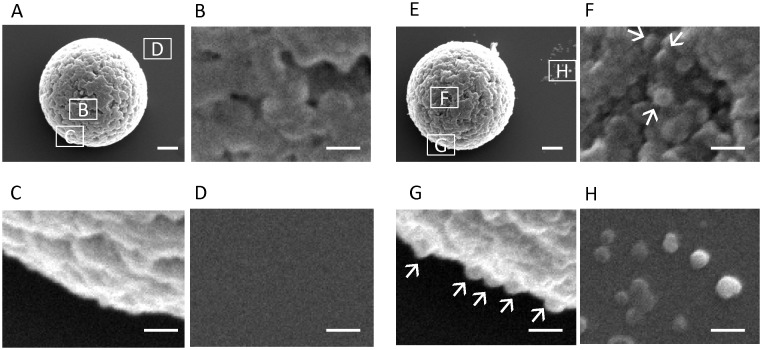
Figure 2. Electron microscopy of SB-Epoxy-MV conjugates.
Electron micrographs of SB-Epoxy incubated with control buffer (A–D) or with the crude MVs (E–H) are shown. Areas of micrographs shown at higher magnification (B–D) and (F–H) are indicated in panels (A) and (E), respectively, by the corresponding boxed letters. MVs are shown by arrows. Bars in (A) and (E): 500 nm. Bars in (B–D) and (F–H): 100 nm.

