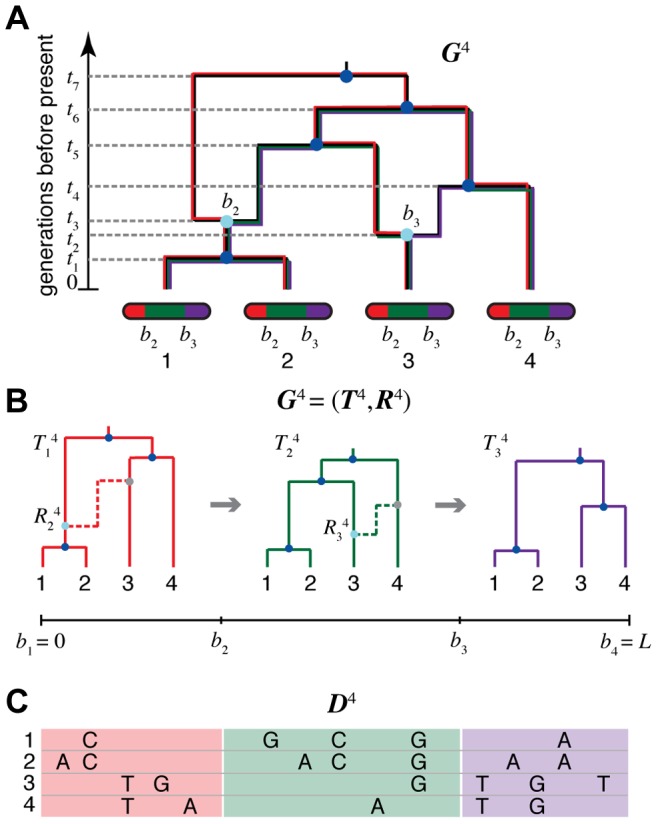
Figure 1. An ancestral recombination graph (ARG) for four sequences.

(A) Going backwards in time (from bottom to top), the graph shows how lineages that lead to modern-day chromosomes (bottom) either “coalesce” into common ancestral lineages (dark blue circles), or split into the distinct parental chromosomes that were joined (in forward time) by recombination events (light blue circles). Each coalescence and recombination event is associated with a specific time (dashed lines), and each recombination event is also associated with a specific breakpoint along the chromosomes (here,  and
and  ). Each non-recombining interval of the sequences (shown in red, green, and purple) corresponds to a “local tree” embedded in the ARG (shown in matching colors). Recombinations cause these trees to change along the length of the sequences, making the correlation structure of the data set highly complex. The ARG for four sequences is denoted
  in our notation. (B) Representation of
  in terms of a sequence of local trees
  and recombination events
  . A local tree
  is shown for each nonrecombining segment in colors matching those in (A). Each tree,
  , can be viewed as being constructed from the previous tree,
  , by placing a recombination event along the branches of
  (light blue circles), breaking the branch at this location, and then allowing the broken lineage to re-coalesce to the rest of the tree (dashed lines in matching colors; new coalescence points are shown in gray). Together, the local trees and recombinations provide a complete description of the ARG. The Sequentially Markov Coalescent (SMC) approximate the full coalescent-with-recombination by assuming that
  is statistically independent of all previous trees given
  . (C) An alignment of four sequences,
  , corresponding to the linearized ARG shown in (B). For simplicity, only the derived alleles at polymorphic sites are shown. The sequences are assumed to be generated by a process that samples an ancestral sequences from a suitable background distribution, then allows each nonrecombining segment of this sequence to mutate stochastically along the branches of the corresponding local tree. Notice that the correlation structure of the sequences is fully determined by the local trees; that is,
  is conditionally independent of the recombinations
  given the local trees
  .
.
