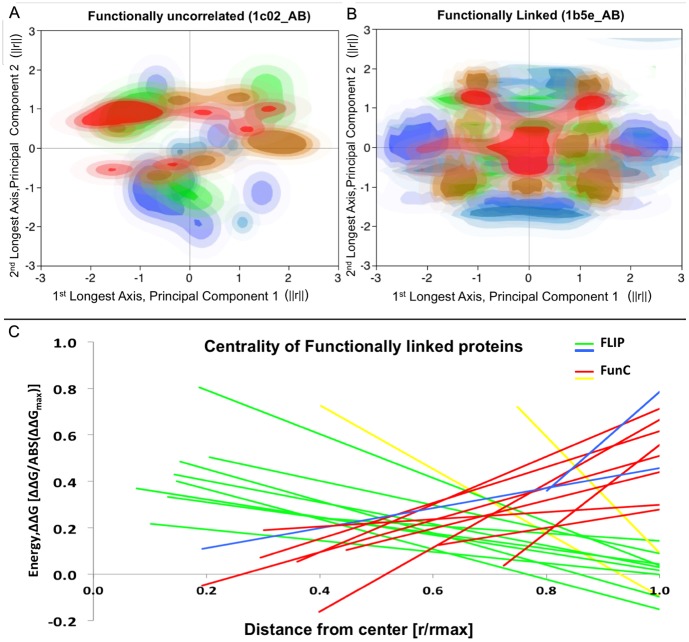
Figure 1. Distribution of alanine substitution energies in FLIP and FunC interfaces.
(a) and (b) show a histogrammed contour plot colored blue-to-red of the ΔΔGala of substitution to alanine of interfacial residues (blue: more favorable values, red: more disruptive values). The plot axes are the first two principal components of the geometric distribution of alanine Cα positions. PCA was used to align the interface along the X- and Y-axes. Axes are normalized. (a) ΔΔGala of the FunC interface from PDBid: 1c02, chains A&B. (b) ΔΔGala of the FLIP interface from PDBid: 1b5e_AB, chains A&B. (c) Linear regressions of ΔΔGala vs. Distance from interface center. Regressions for the interfaces in the FLIPdb training set with the 10 most positive [1acy_HP, 1biq_AB, 2cii_AC, 1b5e_AB, 1edh_AB, 1pky_BD, 1tx4_AB, 1hjc_AC, x1bsf8_AJ, 1bo5_OZ] and 10 most negative [1tzi_AV, 1acy_LP, x1ppf2_EZ, x1dv82_AC, x1wtl_BZ, x1py94_AE, x1erv2_AC, x1gaf2_LY, 1scu_BD, 1c02_AB] intercepts. FLIP are shown in green and blue [1tzi_AV, 1acy_LP]. FunC are shown in red and yellow [x1bsf8_AJ, 1bo5_OZ]. ΔΔGala are normalized to MAX(ABS(ΔΔGala)), while distances of each residue's Cα from the mean of the Cα positions (Center of Interface) are normalized to MAX(distance). All 3 plots generally show that FLIP interfaces are more centralized and radially symmetric than FunC interfaces. 80% of shown positive intercepts are FLIP and 80% of shown negative intercepts are FunC. [Figures (a,b) generated using JMP [46] . Figure (c) generated using Microsoft Excel, 2008]

