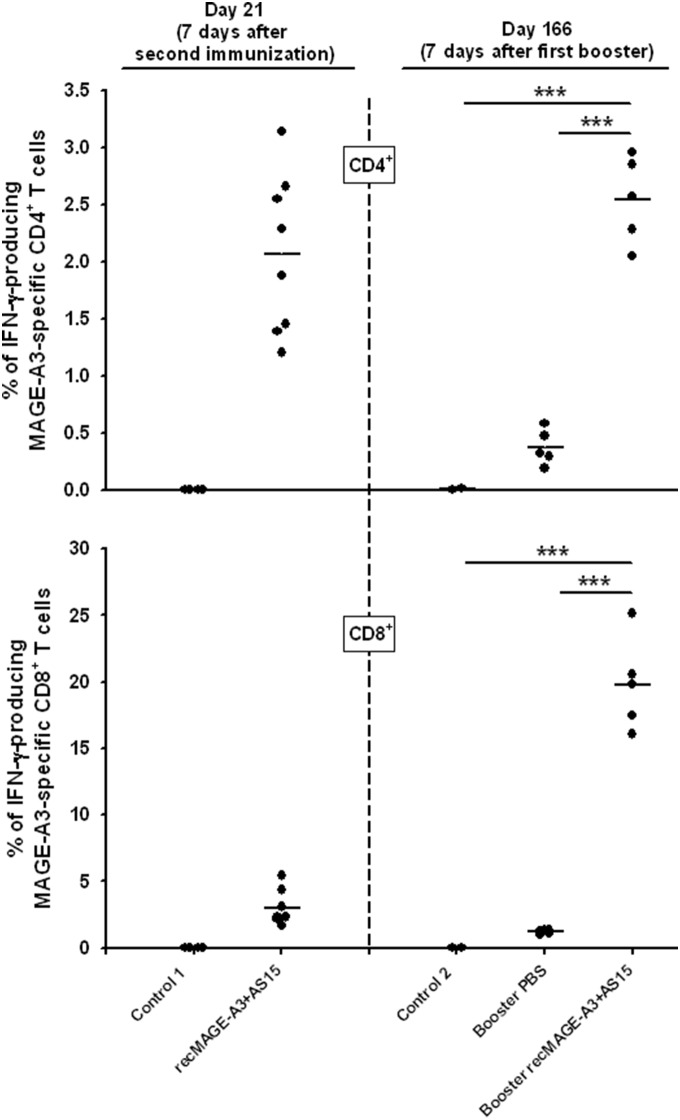
Figure 4. Percentage of IFN-γ-producing MAGE-A3-specific CD4+ and CD8+ T cells.
CB6F1 mice were treated as shown in Figure 3A. Briefly, mice were tumor-challenged after two immunizations with recMAGE-A3+AS15 or PBS (Control 1). Mice of the MAGE-A3+AS15 group remaining tumor-free received either PBS boosters or recMAGE-A3+AS15 boosters. A new control group received PBS (Control 2). Blood samples were taken on Day 21 (7 days after the second immunization) and on day 166 (7 days after the first booster injection). Blood samples were pooled and the amounts of MAGE-A3-specific IFN- γ-producing CD4+ and CD8+ T cells were determined by intra-cellular staining and flow cytometry. Data are expressed as the percentage of total CD4+ and total CD8+ T cells after subtraction of the control medium values, which represented around 0.02% when measuring CD4+ T cells and 0.1% when measuring CD8+ T cells, respectively; each dot is a pool of 3 samples at Day 21 and each dot is a pool of 5 samples on Day 166. *** = p<0.001.

