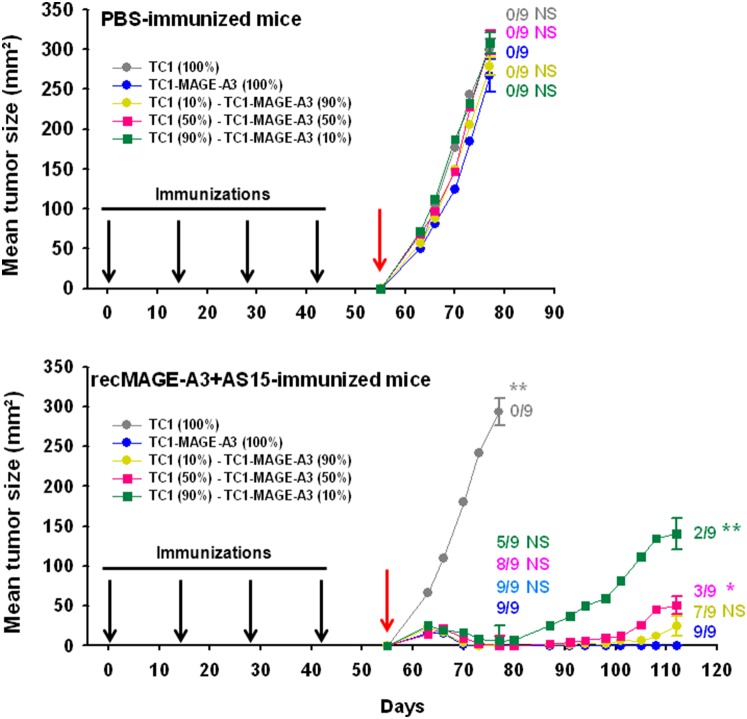
Figure 6. Tumor growth in C57BL/6 mice immunized with PBS (n = 9) or recMAGE-A3+AS15 (n = 9) and challenged with tumor cells containing various percentages (from 0 to 100%) of MAGE-A3-expressing cells.
The mice immunized with recMAGE-A3+AS15 (1 µg of antigen) were followed up to Day 112. On Days 77 and 112, standard errors of the mean are shown and the number of tumor-free mice is indicated for each group. Statistical comparisons of the mean tumor size of each group with that the TC1-MAGE-A3 (100%) group on Days 77 and 112 are shown (* = p<0.01; ** = p<0.001; NS = not significant). Red arrow: day of challenge.

