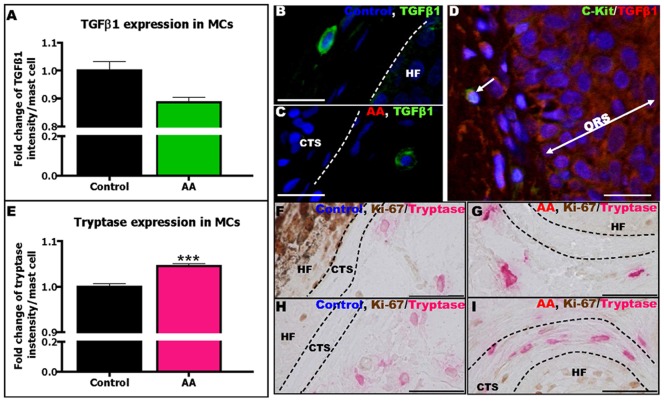
Figure 2. AA MCs contain less TGFβ1 and more tryptase compared to control MCs.
Quantitative analysis of TGFβ1 IR in perifollicular MCs in AA patients compared to controls (A). Analysis derived from 272 MCs around 29 HFs of 10 AA patients and 175 MCs around 19 HFs of 2 healthy controls, ±SEM, Mann-Whitney-U-Test (ns). Representative pictures of TGFβ1+ MCs in human scalp skin of controls (B) and AA patients (C) stained by TGFβ1(green)/c-Kit(red) double-staining. Representative picture of TGFβ1(red)/c-Kit(green) double-staining (D). Quantitative analysis of tryptase IR in perifollicular MCs in AA patients compared to controls (E). Analysis derived from 272 MCs around 41 HFs of 14 AA patients and 182 MCs around 19 HFs of 2 healthy controls, ***p≤0.001, ±SEM, Mann-Whitney-U-Test. Representative pictures of tryptase+ MCs in human scalp skin of control (F,H) and AA patients (G,I) stained by Ki-67/tryptase double-staining. Scale bars: 20 µm (B–D) and 50 µm (F–I). Connective tissue sheath (CTS), hair follicle (HF), outer root sheath (ORS).

