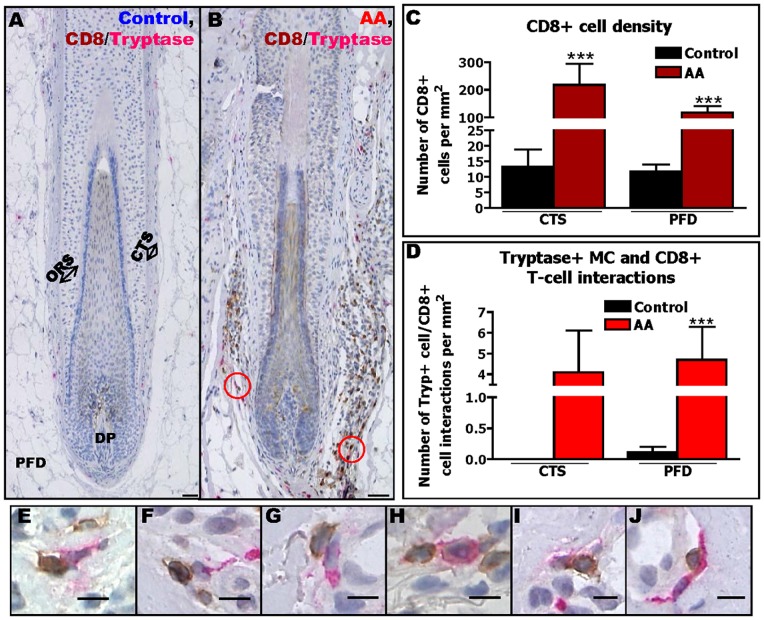
Figure 3. The number of perifollicular CD8+ T-cells and MC-CD8+ T-cell interactions are increased in AA.
Immunohistochemical identification of tryptase+ MCs and CD8+ T-cells in human scalp skin of controls (A) and AA patients (B). Quantitative analysis of CD8+ T-cells (C) and of their interactions with tryptase+ MCs (D). Analysis derived from 56 areas (HFs) from 13 AA patients and 44 areas (HFs) of 7 healthy controls, ***p≤0.001, ±SEM, p value was calculated by Mann-Whitney-U-Test. Non-degranulating MCs (E,G,H) and degranulating MCs (F,I,J) close to CD8+ T-cells Scale bars: 50 µm (A–B) and 10 µm (E–J). Connective tissue sheath (CTS), dermal papilla (DP), outer root sheath (ORS), perifollicular dermis (PFD).

