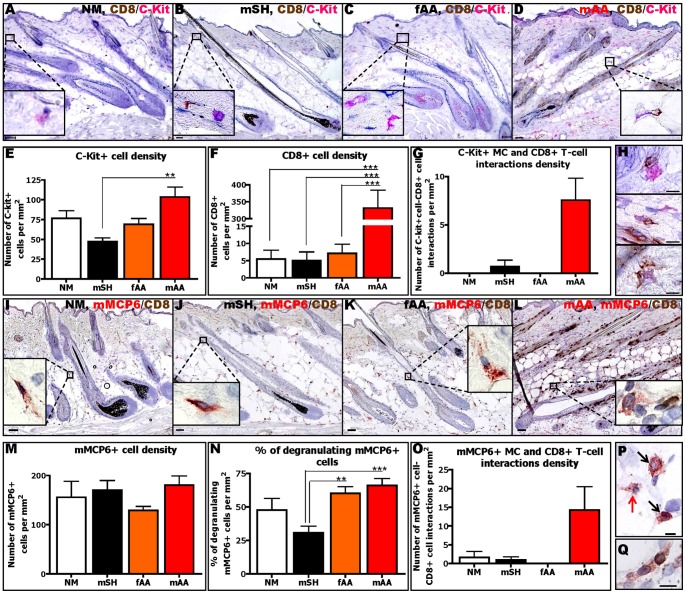
Figure 6. MC numbers, degranulation and interactions with CD8+ T-cells are increased in the C3H/HeJ-mouse-model of AA.
Representative pictures of c-Kit/CD8 double-staining in normal (NM) (A), sham-grafted (mSH) (B), failed-grafted (fAA) (C) and AA (mAA) (D) mice. C-Kit+ MCs are labelled in pink while CD8+ T-cells are labelled in brown. Quantitative analysis of c-Kit+ (E), CD8+ T-cells (F) and c-Kit+ MC/CD8+ T-cell interactions (G) in mAA compared to NM, mSH and fAA control mice. Representative pictures of c-Kit+ MC-CD8+ T-cell interaction (H). Representative pictures of mMCP6/CD8 double-staining in normal (NM) (l), sham-grafted (mSH) (J), failed-grafted (fAA) (K) and AA (mAA) (L) mice. mMCP6+ MCs are labelled in red while CD8+ T-cells are labelled in brown. Quantitative analysis of mMCP6+ cells (M), % of degranulation (N) and mMCP6+ MC-CD8+ T-cell interactions (O) in mAA compared to NM, mSH, fAA control mice. Immunohistochemical identification of non-degranulating (black arrows) and degranulating (red arrow) of mMCP6+ MCs (P) and mMCP6+MC-CD8+ T-cell interaction (Q). Analysis derived from 6 HFs/mouse of 2–4 mice/group ±SEM, One-Way ANOVA or Kruskal-Wallis test followed by Bonferroni's test or Dunn's test (*p≤0.05, **p≤0.01, ***p≤0.001). Scale bars: 50 µm (A–D, M–L) and 10 µm (G,P,Q). AA mice (mAA), failed-grafted AA mice (fAA), normal mice (NM), sham-grafted mice (mSH).

