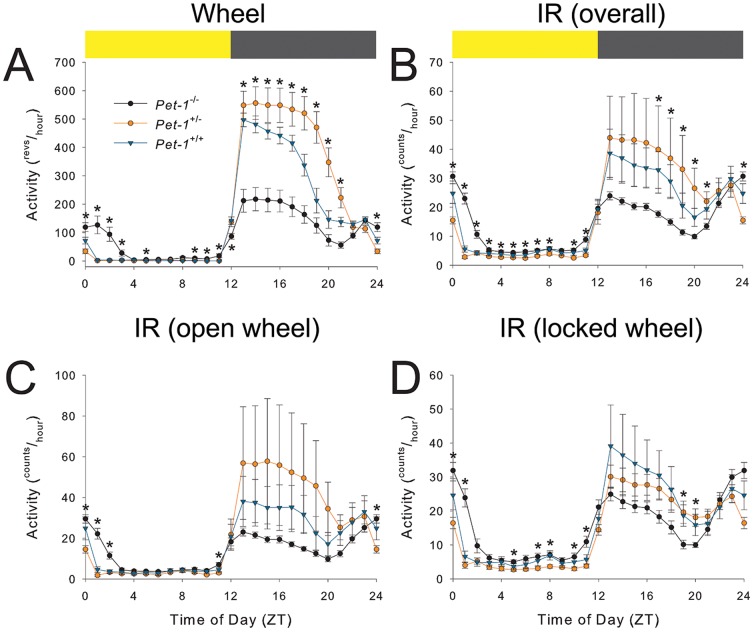
Figure 2. Averaged activity profiles across genotypes as monitored by (a) wheel and (b-d) infrared motion detector (IR) in LD.
Each point represents the average across days and across animals within that particular genotype while in a 12L:12D cycle. Blue points represent Pet-1 +/+ mice; orange points represent Pet-1 +/− mice; black points represent Pet-1 −/− mice. Colored bar (top) represents 24 hour light cycle, where the grey is 12 hours of dark, and the yellow is 12 hours of light. Activity measured in revolutions/hour (a) or counts/hour (b–d). b | Overall IR activity profile of animals regardless of wheel state. These results are further broken-down into IR behavior with a free wheel (c) and with a locked wheel (d). See inset legend (a). Asterisks (*) denote significance at p≤0.05. Note the prominent early morning activity in Pet-1 −/− mice.

