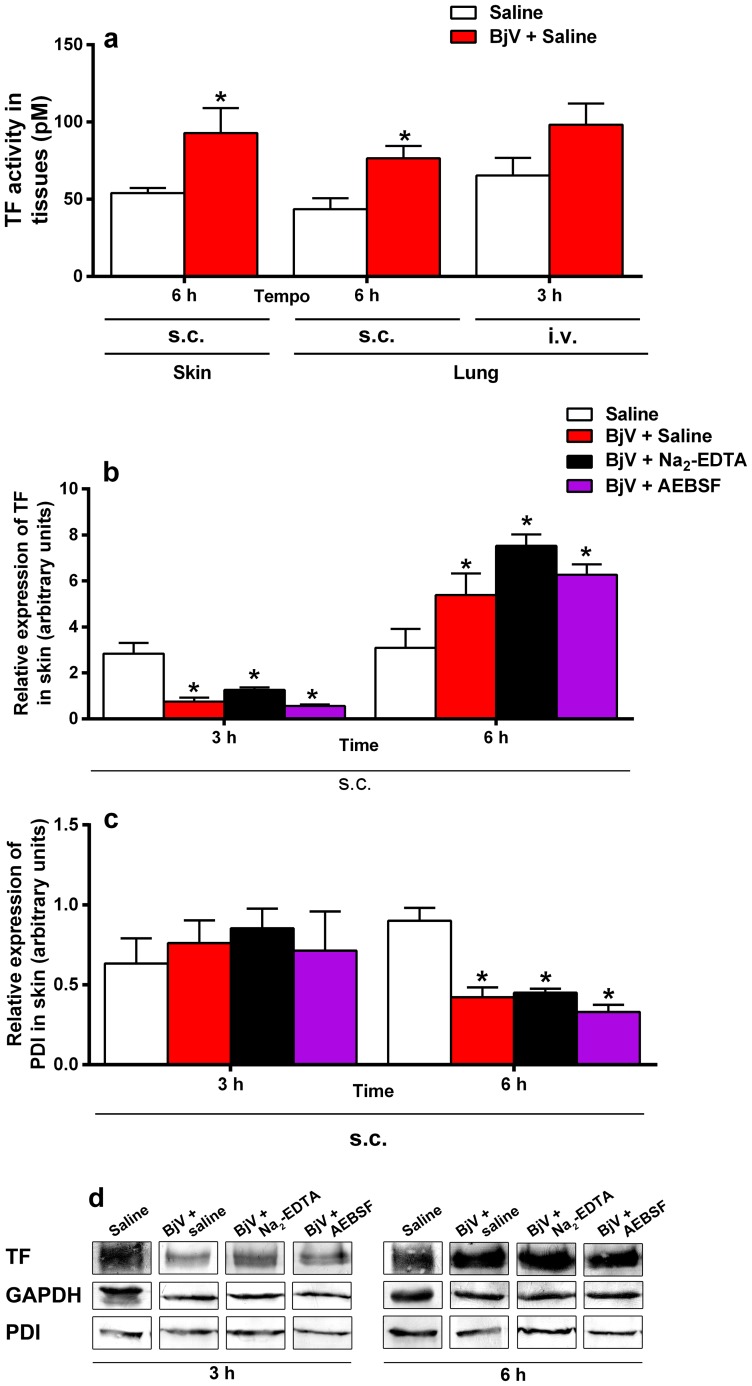
Figure 4. TF activity in skin and lung (a), and protein expression of TF (b) and PDI (c) in skin from rats 3 and 6 h after BjV administration.
Rats were injected s.c. (1.6 mg/kg) or i.v. (100 µg/animal) with venom incubated with saline (BjV+Saline), 13 mM Na2-EDTA (BjV+ Na2-EDTA) or 4 mM AEBSF (BjV+AEBSF). Control animals were treated under the same conditions, but were injected with saline (Saline). *p<0.04 compared with saline-treated rats (Saline). Data are expressed as mean ± s.e.m (n = 5–6/group). (d) Typical results obtained from western blottting analysis of TF (47 kDa), PDI (57 kDa), and GAPDH (37 kDa, internal control) bands from skin homogenates at 3 and 6 h after venom or saline injection. The intensity of the bands was quantified by densitometry and the values obtained from the analysis of 5–6 individuals are shown in figures b and c.

