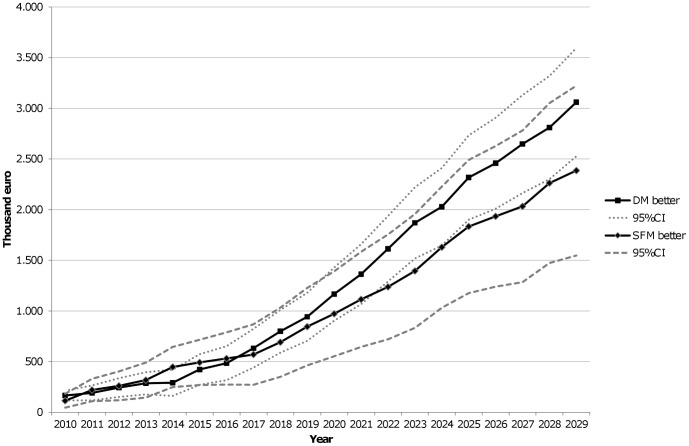
Figure 3. Sensitivity analysis results.
DM better (n = 921 runs): Digital mammography higher detection rate and lower recall rate, or digital higher detection rate and similar recall rate, or digital lower recall rate and similar detection rate. SFM better (n = 469 runs): Screen-film mammography higher detection rate and lower recall rate, or SFM higher detection rate and similar recall rate, or SFM lower recall rate and similar detection rate. Intermediate scenario (n = 610 runs, not shown): Digital higher detection rate and SFM lower recall rate, or digital lower recall rate and SFM higher detection rate, or both similar detection and recall rates. CI: Confidence Interval.

