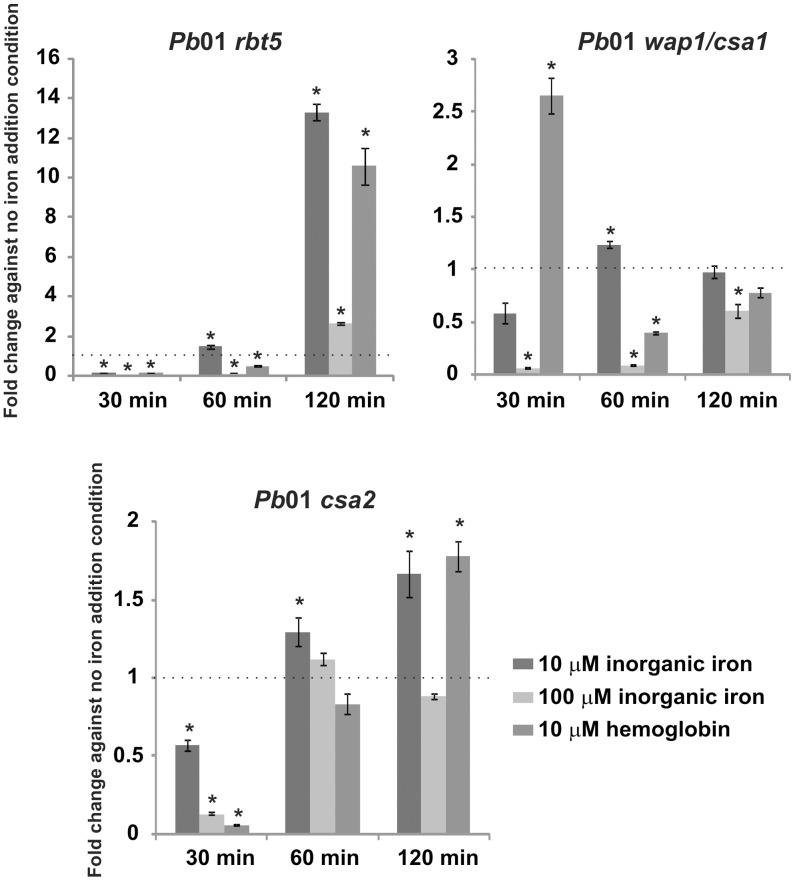
Figure 5. Expression of genes that are putatively related to hemoglobin uptake.
Pb01 yeast cells were recovered from MMcM medium, which was supplemented or not (no iron addition condition) with different iron sources (10 µM and 100 µM inorganic iron and 10 µM hemoglobin) for 30, 60 and 120 min. After RNA extraction and cDNA synthesis, levels of Pb01 rbt5, wap1 and csa2 transcripts were quantified by qRT-PCR. The expression values were calculated using alpha tubulin as the endogenous control. The values that were plotted on the bar graph were normalized against the expression data that were obtained from the no iron addition condition (fold change). The data are expressed as the mean ± SD of the triplicates. *statistically significant data as determined by Student's t-test (p<0.05).

