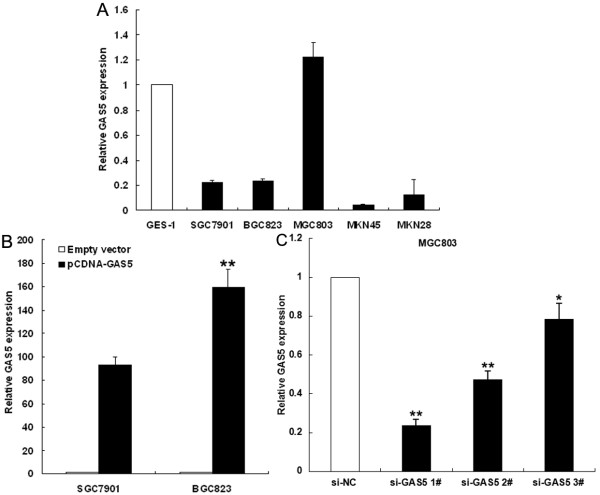
Figure 2.
The level of GAS5 expression in gastric cancer cells. (A) Results from qRT-PCR demonstrating GAS5 expression level of gastric cancer cell lines (SGC7901, BGC823, MGC803, MKN28 and MKN45) compared with normal human gastric epithelial cell line (GES-1). (B) qRT-PCR analyses of GAS5 expression level following treatment BGC823 and SGC7901 cells with pCDNA3.1-GAS5 or empty vector. (C) qRT-PCR analyses of GAS5 expression level following treatment MGC803 cells with si-GAS5 or si-NC. **P < 0.01.

