
Figure 6.
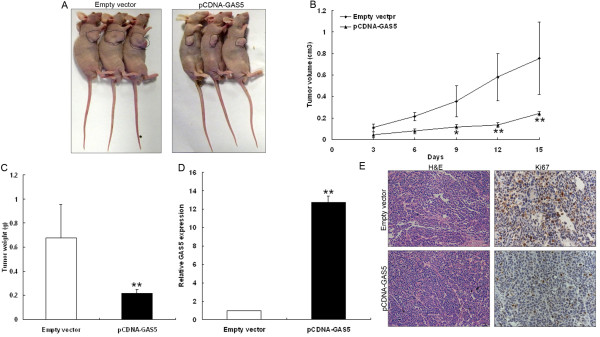
Effects of GAS5 on tumor growth in vivo. (A, B) The tumor volume was calculated every three days after injection of SGC7901 cells stably transfected with pCDNA3.1-GAS5 or empty vector. Points, mean (n = 3); bars indicate S.D. (C) Tumor weights were represented as means of tumor weights ± s.d. (D) qRT-PCR analysis of GAS5 expression in tumor tissues formed from SGC7901/pCDNA3.1-GAS5, SGC7901/Empty vector. (E). Tumors developed from pCDNA3.1-GAS5 transfected SGC7901 cells showed lower Ki67 protein levels than tumors developed by control cells. Upper: H & E staining; Lower: immunostaining. * P < 0.05; ** P < 0.01.