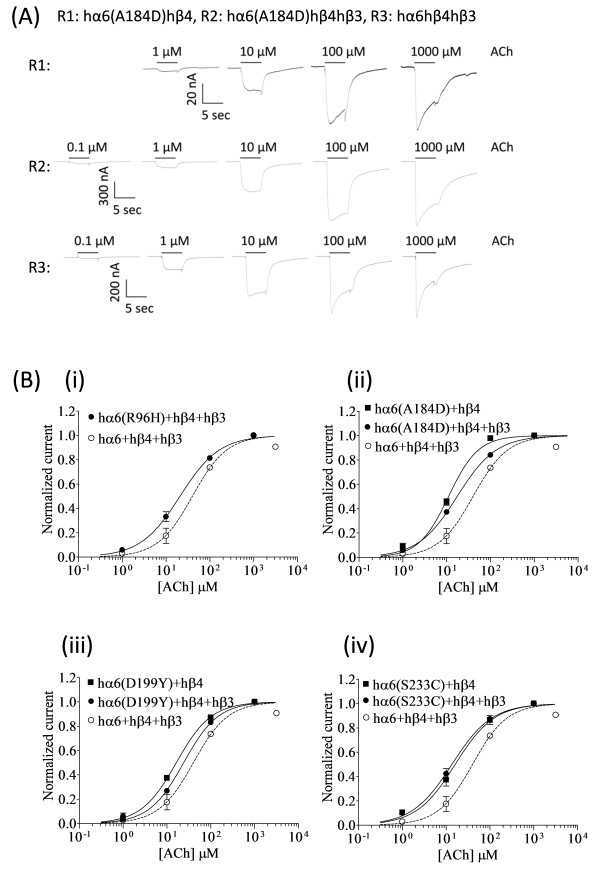
Figure 8.
Variations in nAChR hα6 subunit influence the ACh sensitivity of hα6hβ4*-nAChRs. (A) Representative traces are shown for current responses from oocytes (voltage clamped at −70 mV) responding to the application of indicated concentrations of ACh (shown with the duration of drug exposure as black bars above the traces) and expressing indicated nAChR (i.e., R1: hα6A184Dhβ4-nAChR, R2: hα6A184Dhβ4hβ3-nAChR, R3: hα6hβ4hβ3-nAChR]. (B) Results averaged across experiments were used to produce concentration-response (CR) curves (ordinate-mean normalized current ± SEM; abscissa - ligand concentration in log μM) for inward current responses to ACh as indicated for the nAChR expressed in oocytes and voltage clamped at −70 mV. Current amplitudes are represented as a fraction of the peak inward current amplitude in response to the most efficacious concentration of ACh. Leftward shifts in ACh CR curves for hα6R96Hhβ4hβ3-(●) [(B) (i)], hα6A184Dhβ4hβ3-(●) [(B) (ii)], hα6D199Yhβ4hβ3-(●) [(B) (iii)], or hα6S233Chβ4hβ3-(●) [(B) (iv)] nAChR are evident relative to that of hα6hβ4hβ3-nAChR (○). Furthermore ACh curves for hα6A184Dhβ4-(■) [(B) (ii)], hα6D199Yhβ4-(■) [(B) (iii)], or hα6S233Chβ4-(■) [(B) (iv)] nAChR are shifted leftward relative to those nAChR containing the same subunits but in the additional presence of hβ3 subunits. See Table 3 for parameters of ACh action.

