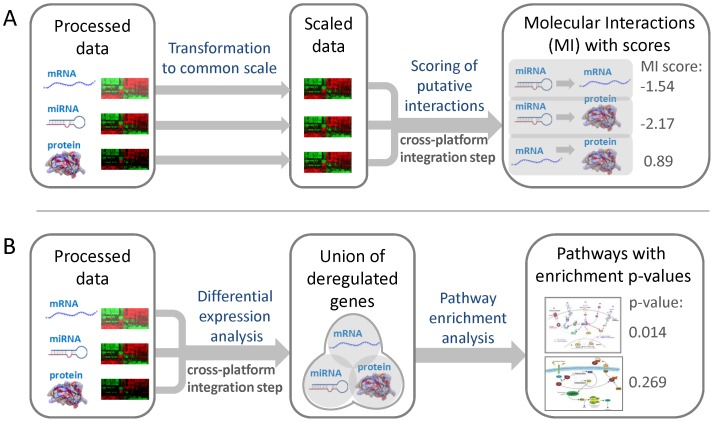
Figure 1. Feature representations used for cross-toxicogenomics prediction models. (A) Molecular interaction features.
The processed data from the different platforms, given in the form of log2-transformed fold changes, were mapped to the same interval (here: [−1, 1]) using a linear function in order to account for the different dynamic ranges of the platforms. Next, putative interactions between molecules represented on different platforms were inferred based on negatively or positively correlated expression profiles. For miRNAs, all possible interactions to experimentally validated and predicted mRNA targets were considered. Associations between mRNAs and proteins were made based on common gene loci. The connections between miRNAs and proteins can be transitively inferred from the corresponding mRNA interactions. In order to obtain a numeric feature representation, a score was computed for each interaction, which equals the product of the scaled log-ratios calculated for the two interacting molecules. (B) Pathway enrichment features. First, differentially expressed features were detected for each platform separately based on appropriate fold change and/or p-value cutoffs. All transcripts and proteins were mapped to the corresponding genes in order to facilitate their association with metabolic and signaling pathways. As miRNAs are typically not contained in canonical pathways, deregulated miRNAs were represented by the genes corresponding to their experimentally confirmed target mRNAs in order to model their impact on pathways. The union of deregulated genes was computed across platforms. Then a hypergeometric test was applied to determine enriched pathways represented by these genes. Finally, a feature vector was constructed, representing the log10-transformed p-values obtained for each pathway from the overrepresentation test.

