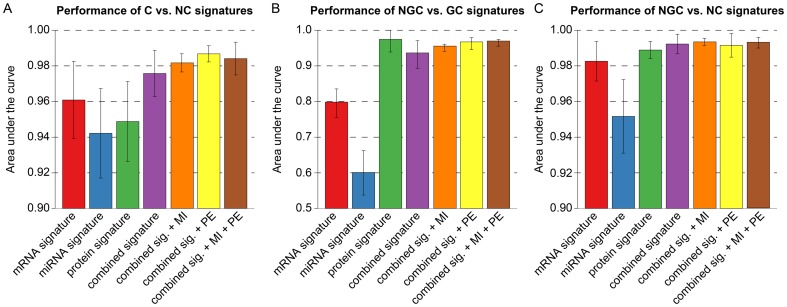
Figure 3. Classification performance for different class contrasts depending on signature types.
The bar plots correspond to the average area under the ROC curve obtained from five widely used supervised classification methods (SVM, RF, NN, PCR, and BGLM). Before averaging across classifiers, the prediction scores were integrated across repetitions and cross-validation folds. Each column corresponds to a certain signature type, which may be composed of different modules. The combined signature contains all predictive features from the mRNA, miRNA, and protein signatures. +MI and +PE indicate the additional use of molecular interaction and pathway enrichment features, respectively. Bar plots were generated for (A) C vs. NC classification, (B) NGC vs. GC classification, and (C) NGC vs. NC classification.

