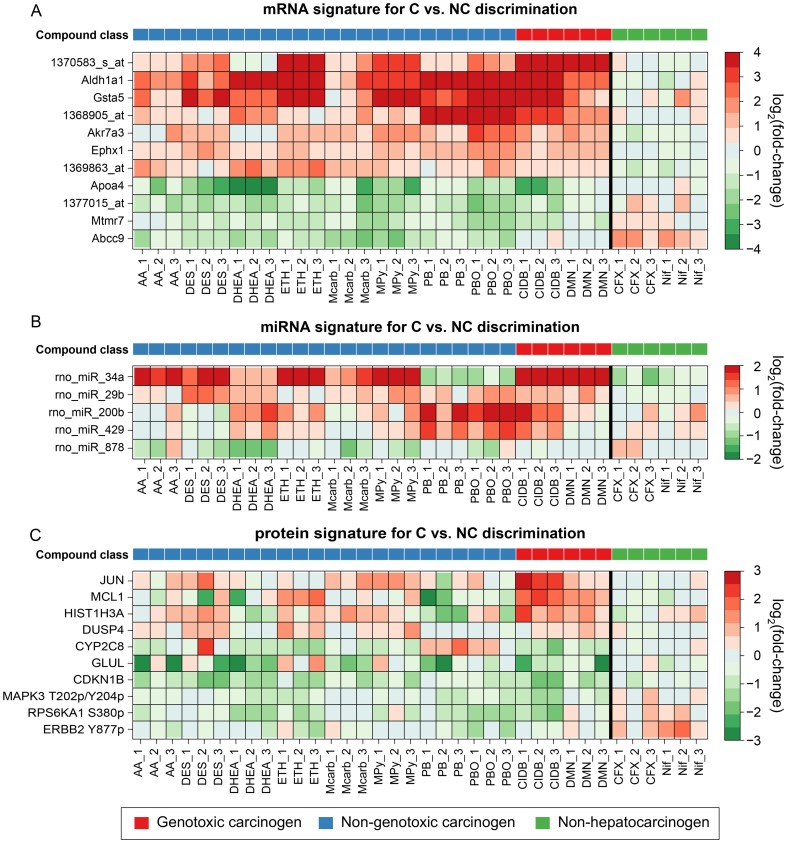
Figure 4. Heatmap plots of single-platform signatures for C vs. NC classification.
The heatmaps depict characteristic expression patterns observed in livers of rats after exposure to diverse rodent liver carcinogens and non-carcinogens. A selection of signature molecules is shown for each profiled molecular level: (A) mRNA expression, (B) miRNA expression, and (C) protein expression. In each heatmap, rows correspond to signature molecules and columns correspond to liver samples from differentially treated rats. The bold vertical lines separate the carcinogens from the Non-carcinogens. Plotted are the log2(fold changes), where red indicates up-regulation and green indicates down-regulation (see color keys). The color bar on top refers to the compound class (see legend).

