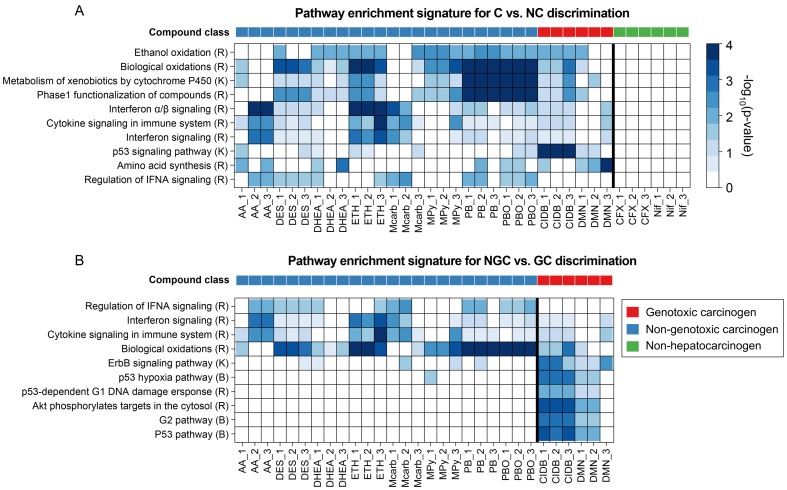
Figure 5. Heatmap plots of pathway enrichment signatures.
The heatmaps depict overrepresentation of genes involved in relevant pathways among the genes deregulated in liver upon treatment of rats with a certain compound. Pathways relevant for compound classification were selected by SVM-RFE for different class contrasts: (A) C vs. NC and (B) NGC vs. GC. The rows correspond to canonical pathways from the databases Reactome (R), KEGG (K), or BioCarta (B) and the columns correspond to samples. The bold vertical lines separate sample classes. The color of each cell refers to the -log10(p-value) obtained from a hypergeometric overrepresentation test and indicates the significance of a certain pathway enrichment (see color key). The color bar on top of each heatmap denotes the carcinogenic class (see legend).

