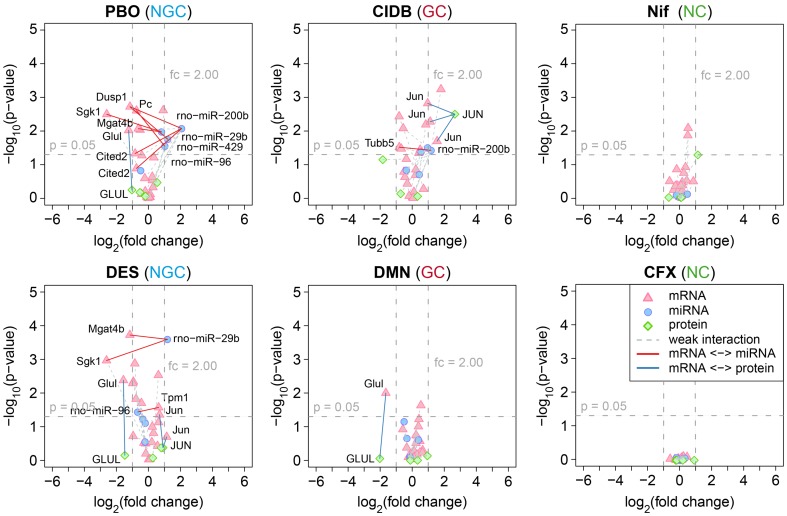
Figure 6. Volcano plots of molecular interaction signatures.
Shown are volcano plots for two representative compound profiles of each of the three compound classes (i.e., NGC, GC, and NC). The plots represent putative molecular interactions between different molecular layers, which were found to be predictive for C vs. NC classification. For each interacting molecule (i.e., mRNA, miRNA, or protein) the strength of its differential expression was assessed in terms of the log2(fold change) and plotted against its significance, which is given by the FDR-corrected log10(p-value) obtained from a moderated t-test. Different shapes and colors denote different types of molecules (see legend). Colored edges were used to highlight molecular interactions for which a positive or negative correlation was observed between two molecule types. We considered correlations in the expression profiles of miRNAs and their experimentally confirmed or predicted mRNA targets, as well as between mRNAs and proteins sharing the same genomic locus. As a formal criterion for a putative molecular interaction, we required that for both interaction partners a 50% increase or decrease in expression could be observed relative to the controls.

